Statistics
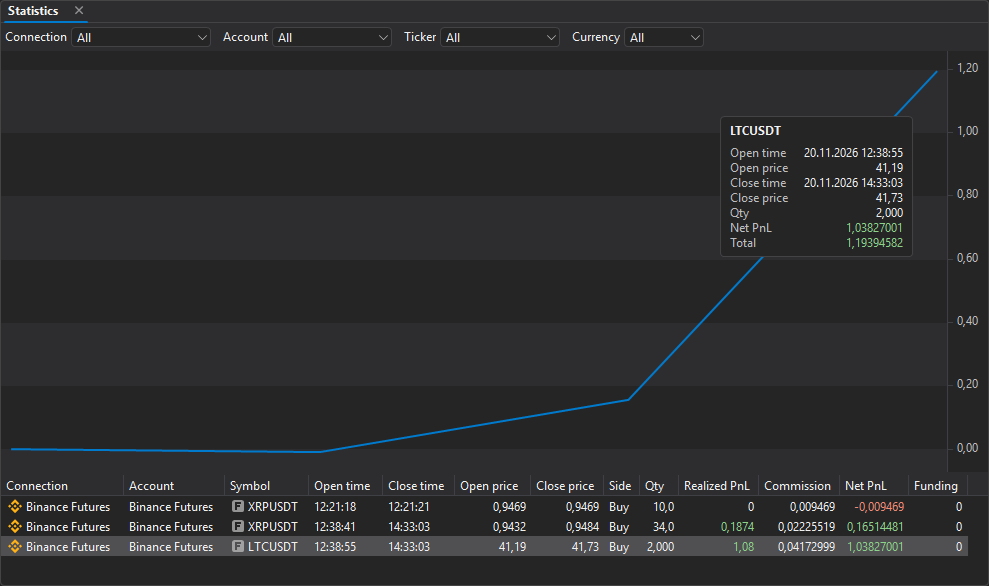
The Statistics window helps you analyze closed trading operations. It consists of a filter row, a result chart and an operations table.
Result chart
The upper part of the window shows a chart of the financial result over closed operations: each point is the cumulative Net PnL after the next trade, trades go by close time. If the result improves, the line goes up; if it worsens, the line goes down. The chart gives you a quick view of trading performance without reviewing each operation individually.
The chart is built only from the trades shown in the table — that is, with the filters applied.
Point tooltip
Hover over the chart — the point under the cursor shows a tooltip about the trade that led to it. The header is the symbol, below it are Open time, Open price, Close time, Close price, Qty, the trade’s Net PnL and Total — the cumulative result at this point. Times are shown with the date, amounts are colored as profit or loss.
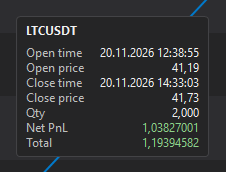
Chart currency
The curve is built in a single result currency: amounts in different currencies (for example, USDT and RUB) are not added up. If a currency is selected in the Currency filter, the chart is built from the trades in it. If All is selected, the chart is built in the currency that has the most trades among the shown ones.
Filters
Above the chart is the filter row: Connection, Account, Ticker and Currency. They select the table rows and, with them, the chart trades. All means no selection by this field.

The lists are built from the window’s trades, and each one takes the filters to its left into account: Account lists the accounts of the selected connection, Ticker the symbols of the selected connection and account, Currency the currencies of the selected trades. Currencies go by the number of trades; trades with an unknown currency are the ”?” item at the end. If after you change the connection it has no trades with the selected account, symbol or currency, those filters are reset to All.
The choice is saved in the window settings. If the filters do not fit the window width, they wrap to the next line.
The filter row is hidden together with the toolbars of other windows by the Hide window toolbars command — see Hiding panels and tabs.
Columns
| Column | Description |
|---|---|
| Connection | Trading connection. |
| Account | Account on which the operation was made. |
| Symbol | Symbol. |
| Open time | Operation open time. |
| Close time | Operation close time. |
| Open price | Open price. |
| Close price | Close price. |
| Side | Operation direction. |
| Qty | Operation volume. |
| Realized PnL | Realized result. |
| Commission | Fee. |
| Net PnL | Total financial result: Realized PnL − Commission + Funding. |
| Funding | Funding during the trade: ”+” — received, ”−” — paid. |
Context menu
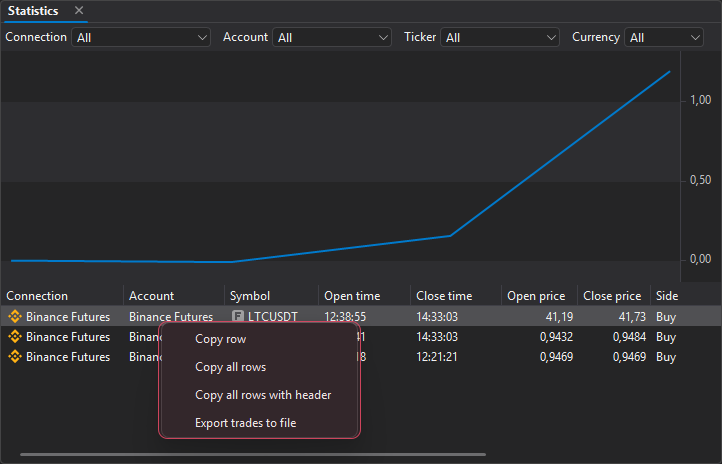
Right-click the trade table to open the context menu with copy and export commands. The Copy row item appears only when you click a row.
| Command | Description |
|---|---|
| Copy row | Copies the data of the selected trade to the clipboard. |
| Copy all rows | Copies the data of all displayed trades to the clipboard, for example to transfer the list to another document or application. |
| Copy all rows with header | Copies all displayed trades to the clipboard along with the column names. This is convenient for pasting data into Excel, Google Sheets, or another spreadsheet editor. |
| Export trades to file | Saves all displayed trades to a CSV file: with column names, ”;” as the separator, UTF-8 encoding. Excel opens such a file directly. |
Example of rows copied with Copy all rows with header:
Connection    Account    Symbol     Open time    Close time    Open price
Binance       Spot       XRP/USDT   19:34:30     23:54:09      1.0092
Export to a file is useful to:
- save your trade history;
- share trades with another person;
- analyze your trading;
- use the data in third-party programs;
- create a backup of your history.
Tip: To quickly copy a single trade, choose Copy row. To save the entire table for further analysis, choose Export trades to file.
Chart screenshot
You can save the result chart as an image — for example, to share the results of the day. Use the common hotkeys Screenshot to clipboard and Screenshot to file. They are not assigned by default — assign them before use.
- Click the chart or the operations table in the Statistics window so that the window has focus.
- Press the key:
- Screenshot to clipboard — the chart image is copied to the clipboard, and you can paste it right into a messenger or document;
- Screenshot to file — the Save screenshot as PNG window opens. Choose the folder and file name (by default
Screenshot_YYYY-MM-DD.png) and click Save.
The screenshot contains only the result chart, without the operations table.