Zooming and moving
Moving and zooming change which part of the history is on screen and how large it is: scroll the chart back to find past levels, stretch it to look at individual bars, or compress it to see the whole day.
Moving
To browse the history, move the chart in one of these ways:
- hold down the left mouse button anywhere in the chart area and move the mouse in the desired direction (the chart moves vertically only while automatic vertical scaling is off — for example, after you change the vertical zoom);
- use hotkeys — see Chart hotkeys.
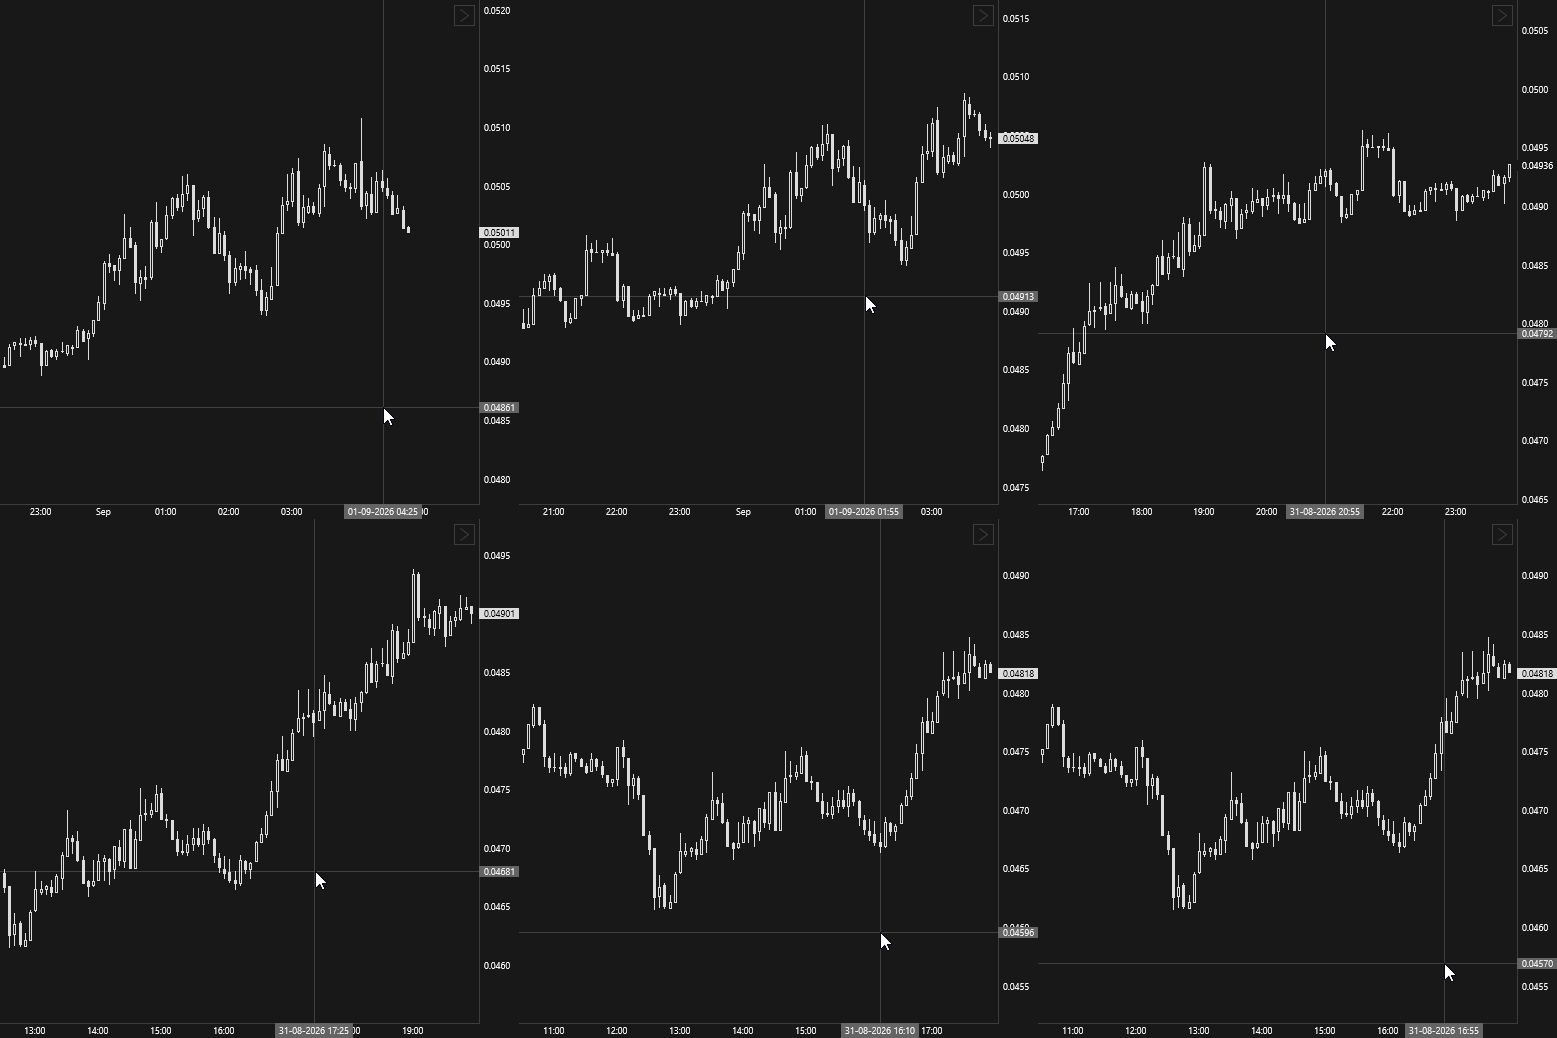
If the chart is moved away from the last bar, an arrow button appears in the upper right corner of the chart area. Click it to return to the last bar; the button also turns automatic vertical scaling back on.
Zooming
Horizontally
The horizontal zoom defines how many bars fit on the screen.
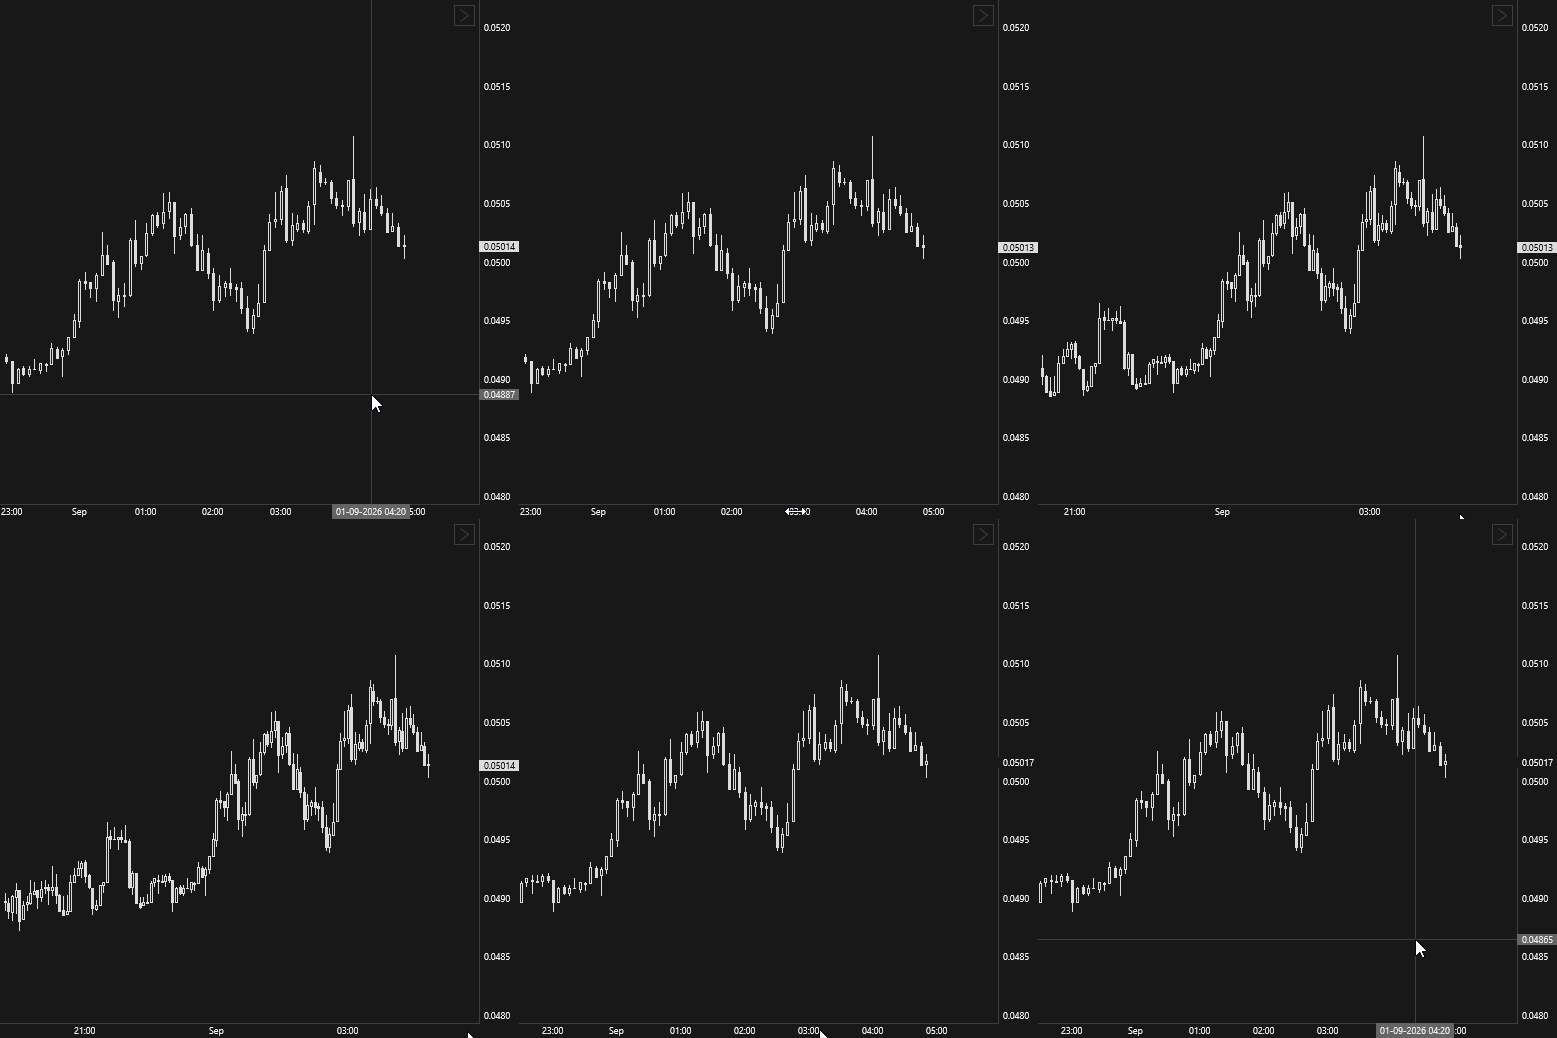
- Hover over the time scale (the cursor turns into a double-headed arrow ↔), hold down the left mouse button and move the mouse left or right.
- Scroll the mouse wheel in the chart area or over the time scale.
- Scroll the mouse wheel while holding Ctrl anywhere on the chart, including over the price scale.
- Use hotkeys — see Chart hotkeys.
Vertically
The vertical zoom defines which price range fits in the height of the area.
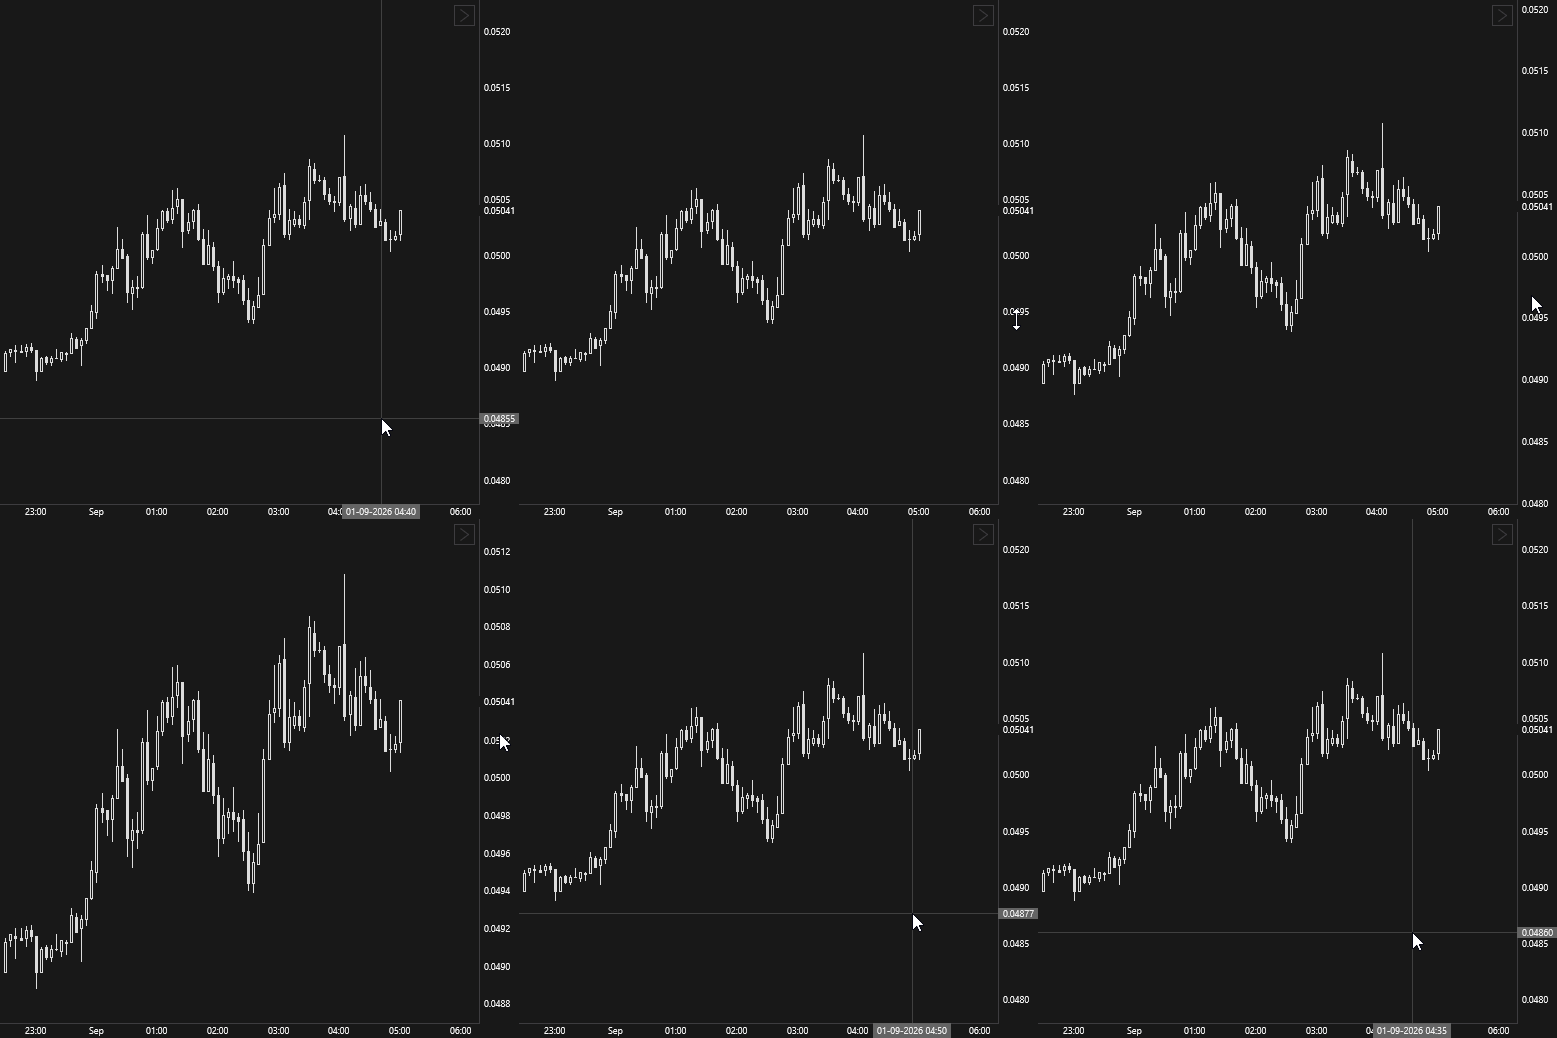
- Hover over the price scale (the cursor turns into a double-headed arrow ↕), hold down the left mouse button and move the mouse up or down.
- Scroll the mouse wheel over the price scale.
- Scroll the mouse wheel in the chart area while holding Shift.
Resetting the zoom
Double-clicking the price scale resets the vertical zoom of that area and turns automatic vertical scaling back on.
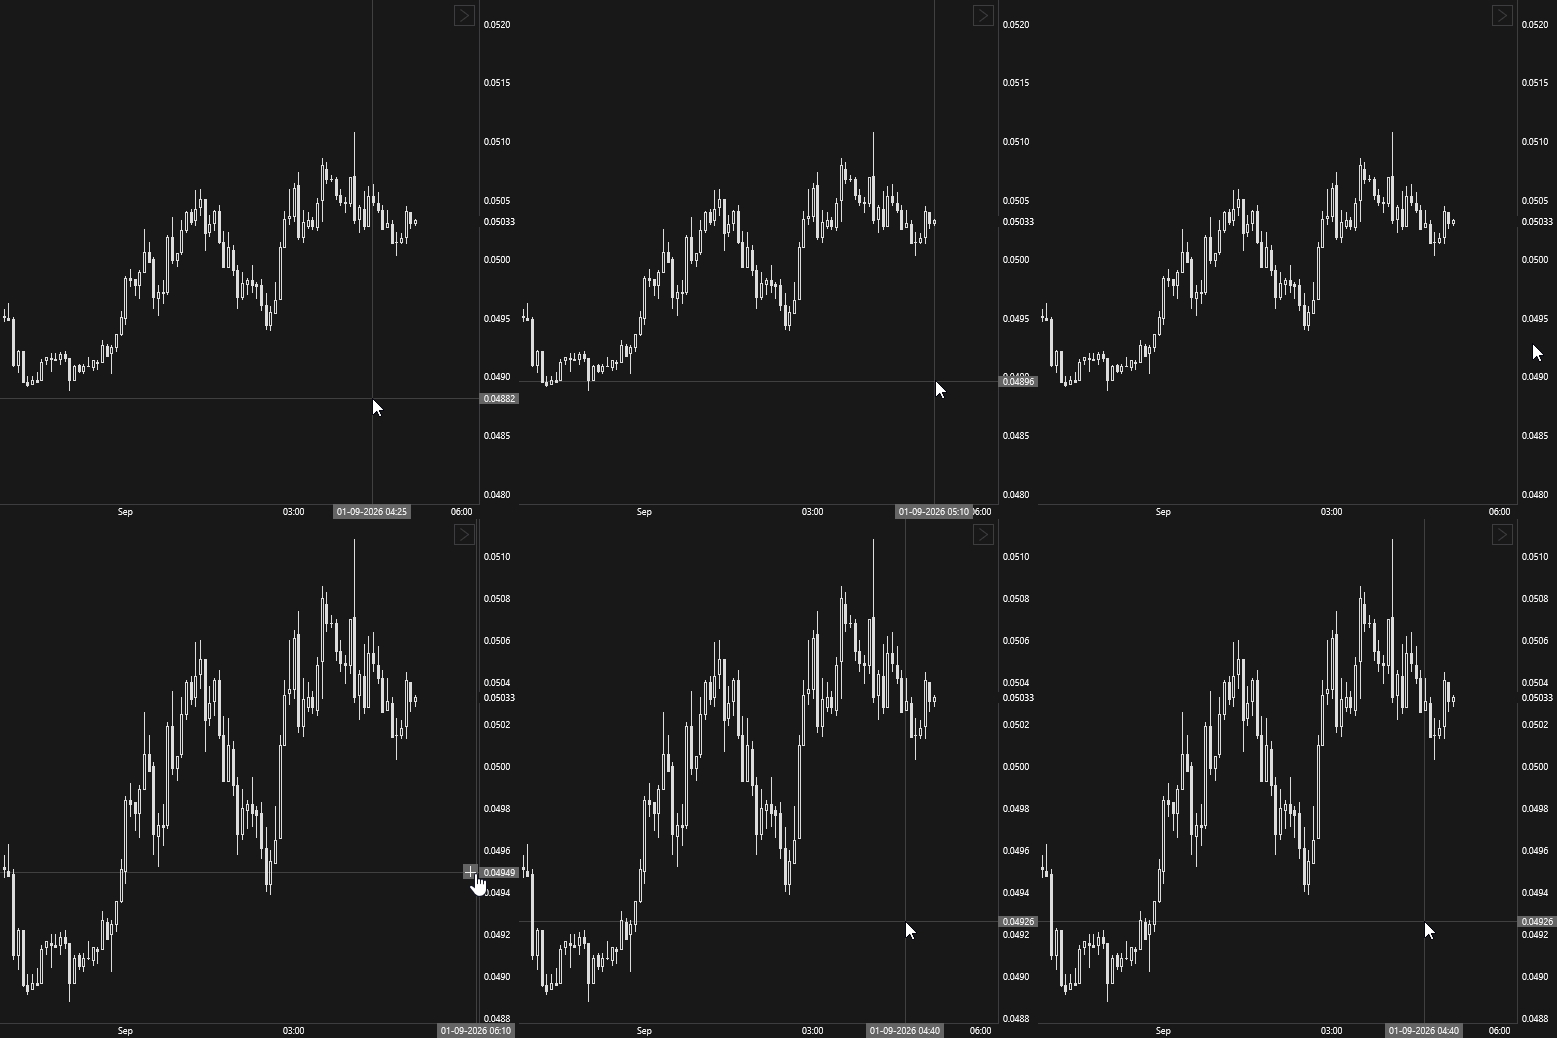
The Reset zoom button on the main panel resets the zoom of the whole chart on both axes.
Ruler
The ruler measures a part of the chart: how much the price changed and how many bars and how much time passed. Hold down the middle mouse button (the wheel) in the chart area and move the mouse. A tooltip next to the cursor shows the price change (Price and Change, %), the number of price steps — ticks (Ticks), the number of bars (Bars), the time (Time) and the volume (Volume) over that part. In an indicator area the tooltip shows the number of bars and the value range (Range).