Clusters area
A cluster is a bar of the selected timeframe broken down by price: each cell shows the volume traded at that price during the bar. Clusters show at which prices most of the trading took place and who was stronger — buyers or sellers.
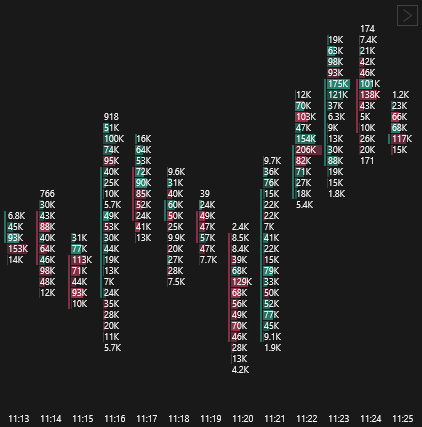
The cluster timeframe is selected on the main panel or in the clusters menu.
Clusters menu
To open the clusters area menu, right-click anywhere in the area. The menu selects what the cells show.
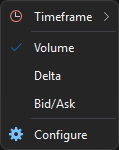
| Menu item | Description |
|---|---|
| Timeframe | Selects the cluster timeframe. |
| Volume | Cells show the total volume traded at the price. |
| Delta | Cells show the delta: the difference between buy volume and sell volume at the price. The value can be negative. |
| Bid/Ask | Cells show both buy volume and sell volume at the price. |
| Configure | Opens the order book settings on the Cluster tab. |
Viewing history
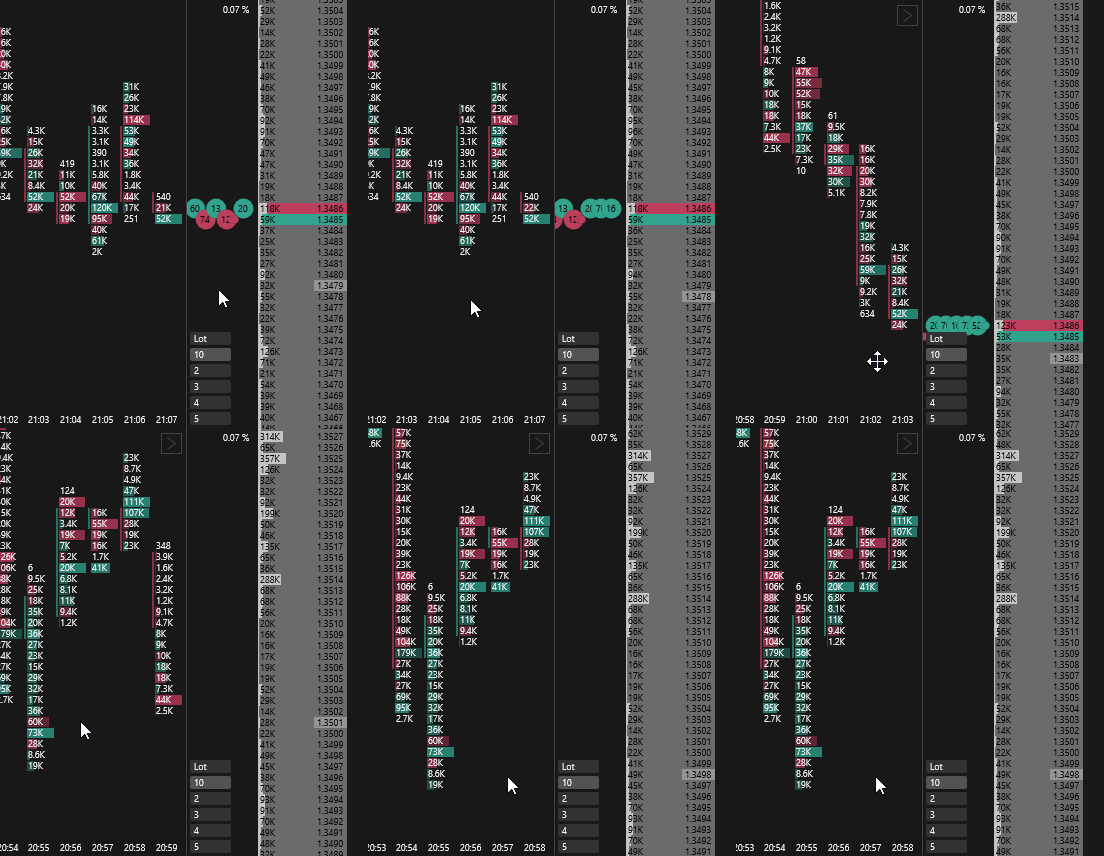
To view past clusters, move them within the area: hold down the left mouse button anywhere in the area and move the mouse in the desired direction.
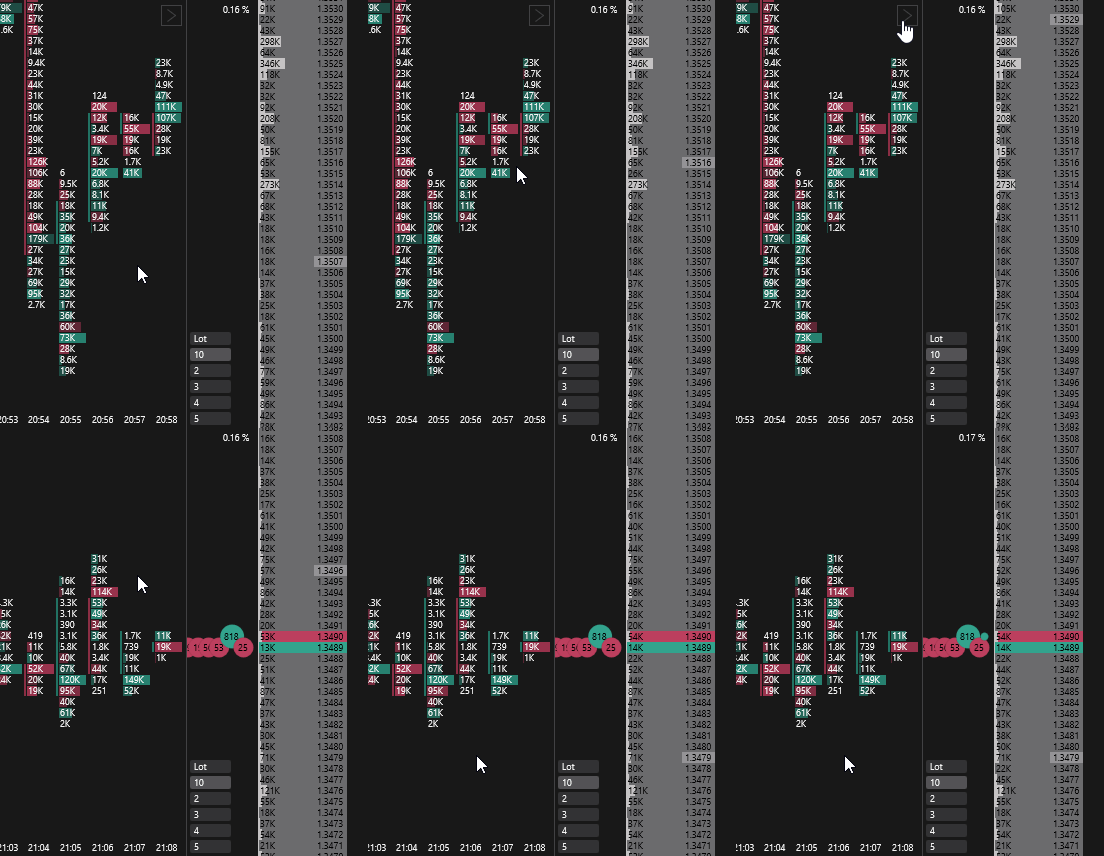
To return to the latest clusters, click the scroll button in the upper-right corner of the area. The button also centers the order book.
Width and hiding the area
Resizing the area
Hover over the border between the clusters area and the tape area, hold down the left mouse button and drag the border left or right.
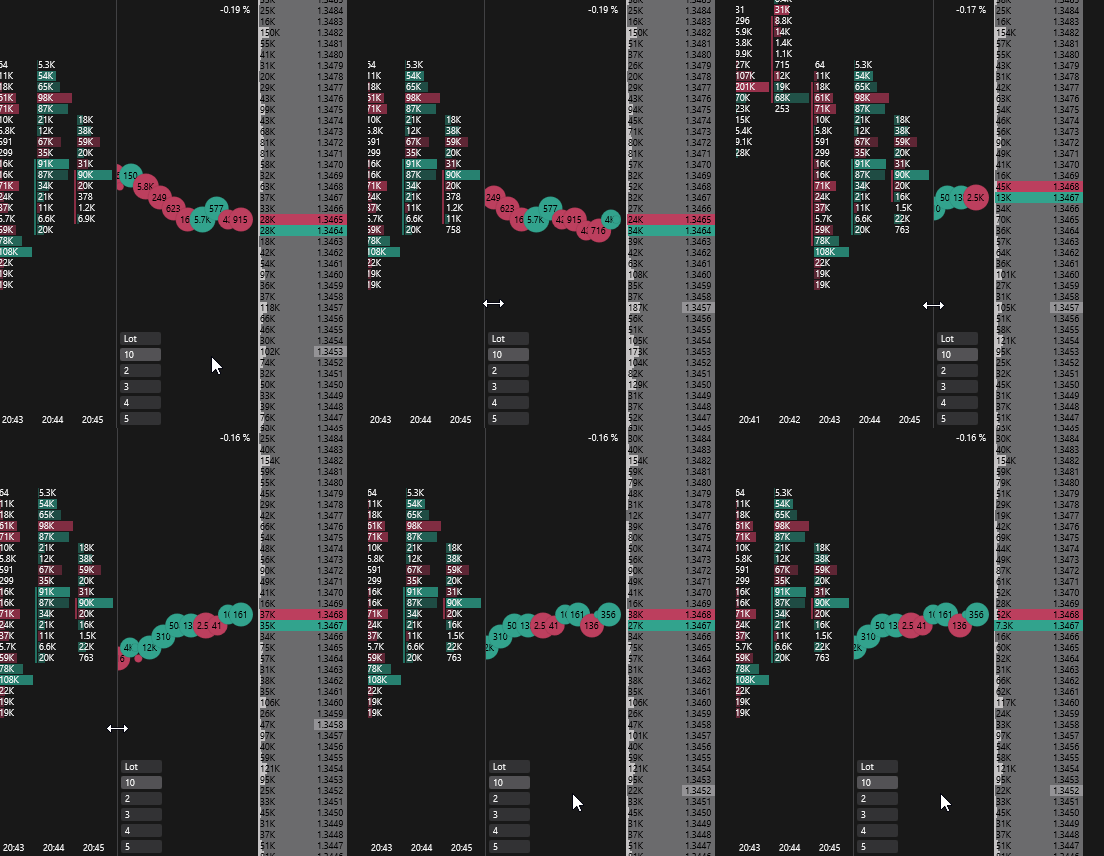
Expanding over the tape
Double-click anywhere in the clusters area — the tape area is hidden and the clusters take its place. Double-clicking again brings the tape area back.
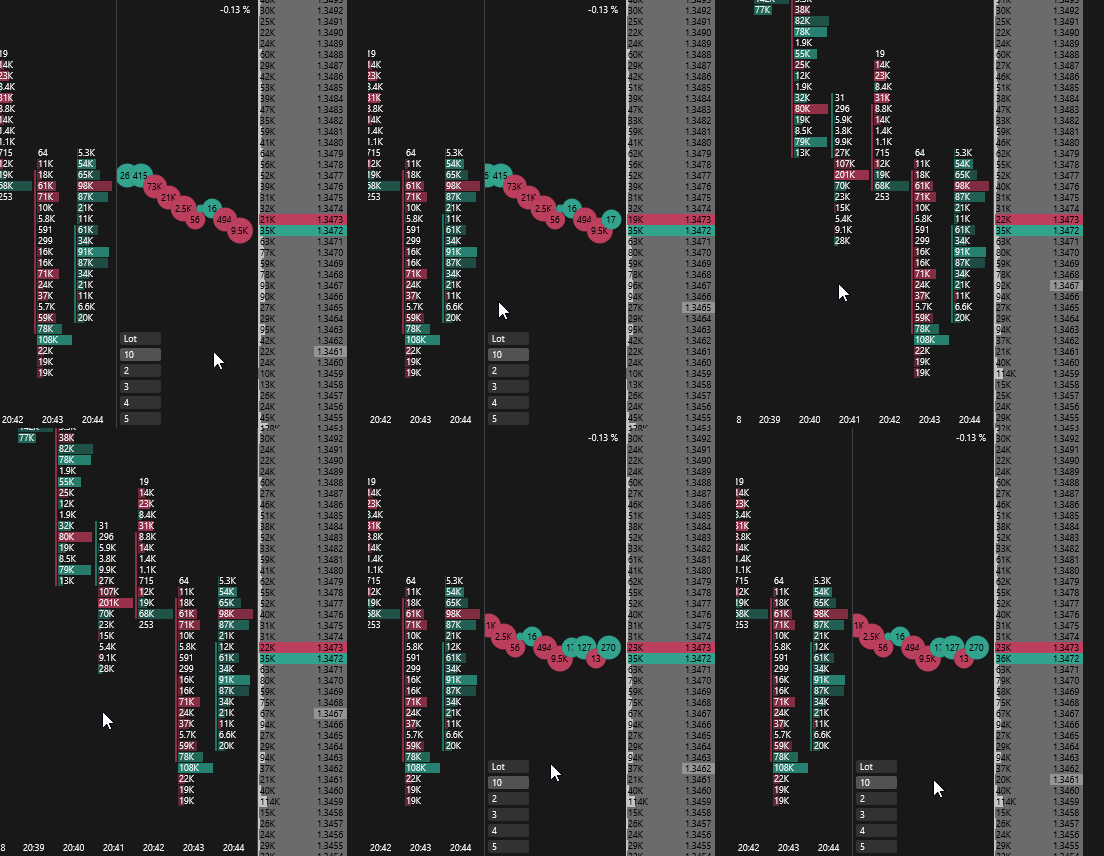
Hiding the area
To hide the clusters area, double-click an empty spot in the tape area. Double-clicking again brings the clusters area back.
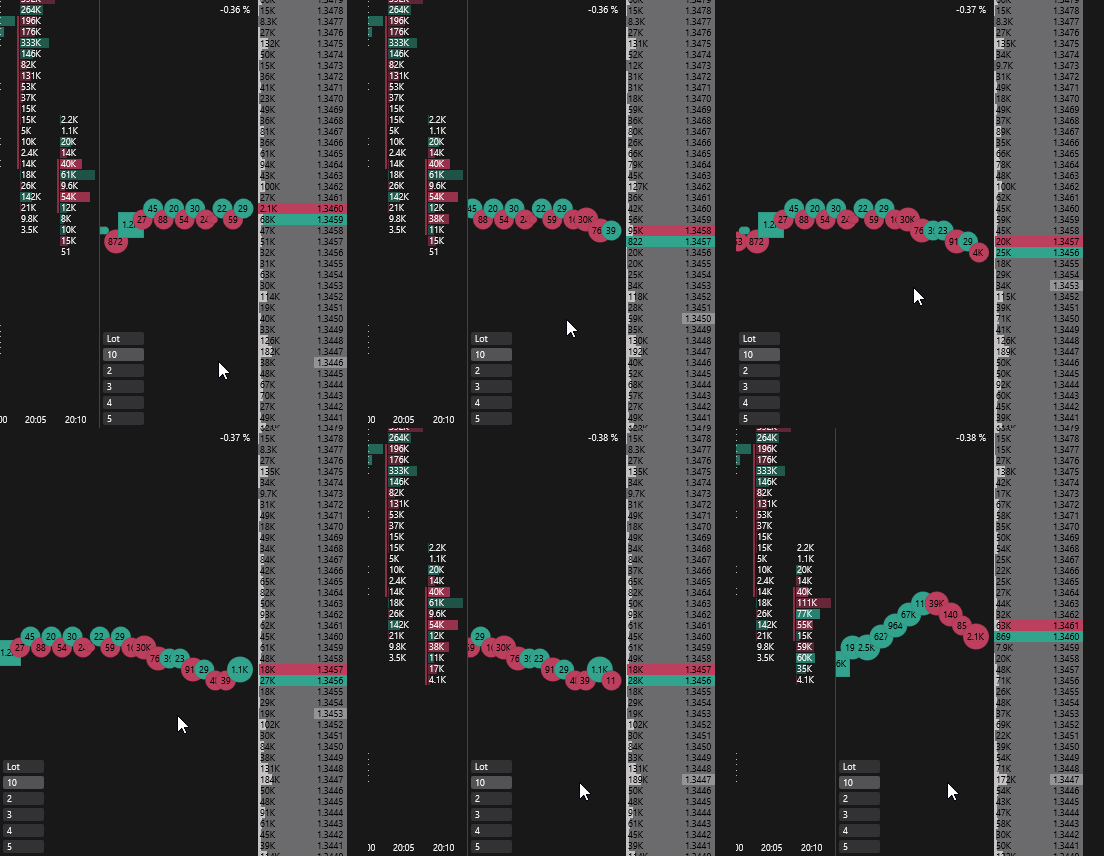
Cluster width
Hover over the clusters area and turn the mouse wheel — the cluster width changes.
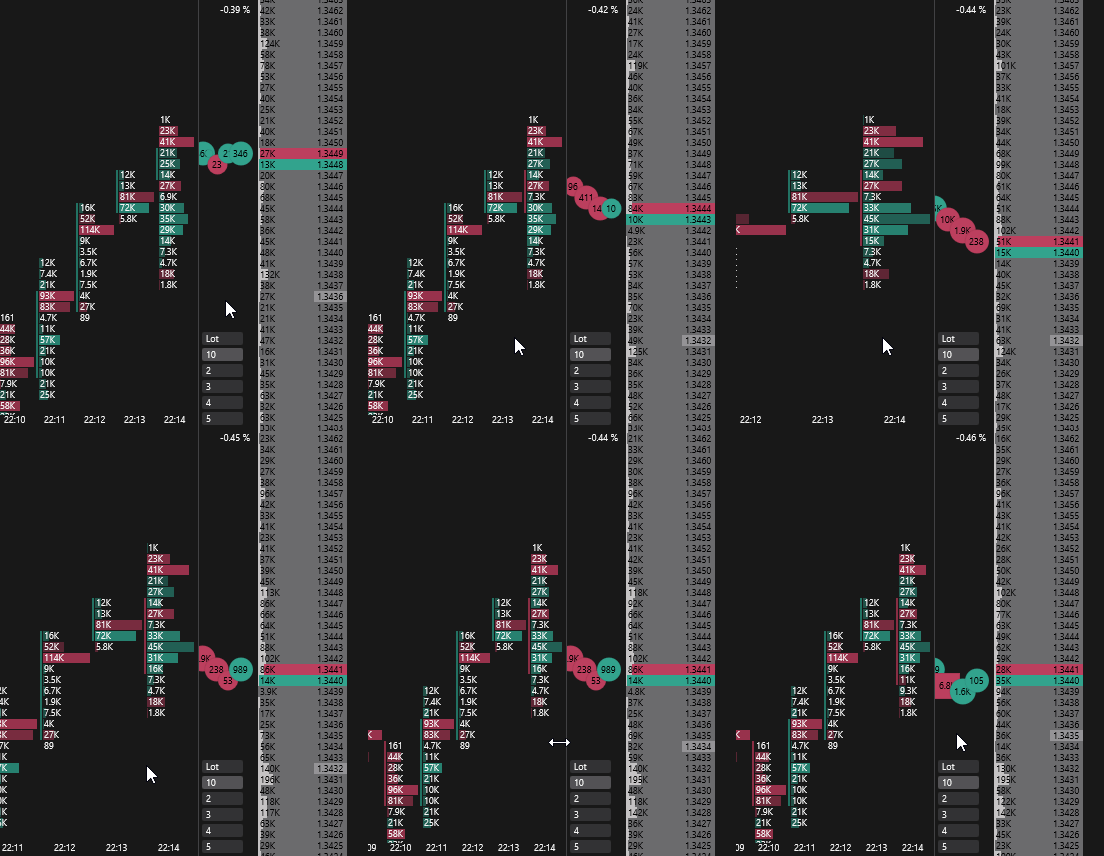
With the Fit cluster and order book scale hotkey held, the mouse wheel over the clusters changes the cluster volume scale instead of the width. The key is not assigned by default — see Order book hotkeys.