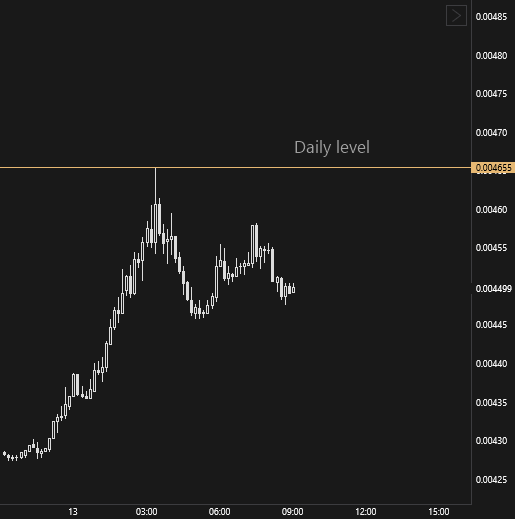
Drawing objects
Drawing objects are lines, shapes and labels that you put on the chart by hand: you mark support and resistance levels, channels, zones and important points in time. How to change an object’s style or delete it is described on the Object manager page.
Adding an object
Pick an object in one of these ways:
- in the Drawing menu on the chart’s main panel;
- with a button on the Drawing panel;
- with a hotkey — see Chart hotkeys.
Then left-click the chart where the object should start. For objects with several points (trend line, channel, rectangle, Fibonacci retracement, volume profile), move the mouse and click to set the next points — or drag with the left mouse button held down.
To cancel building, right-click.
Magnet mode
With Magnet mode on, the object’s points snap to the nearest price of the bar under the cursor — open, high, low or close. This way a level lands exactly on the bar’s extreme rather than next to it. Turn the mode on and off with the Magnet mode item of the Drawing menu or the Magnet button on the Drawing panel.
Horizontal ray by double-click
If the Place level on double click option is on in the global chart settings, double-clicking an empty spot of the chart places a horizontal ray. See Global chart settings.
Moving and copying
To move an object, drag it with the mouse; to change its shape, drag one of its points. An object with the Lock option on in the object manager cannot be moved.
The selected object can be copied, pasted and deleted with hotkeys — see Chart hotkeys.
Drawing panel
The Drawing panel is an extra panel of the chart window with buttons for all drawing objects and a Magnet button. With it, you pick an object in one click without opening a menu. The panel is hidden by default.
To show or hide the panel, right-click the chart area and select Toolbars → Drawing toolbar.
The panel has these buttons:
- Trend line
- Horizontal ray
- Horizontal line
- Vertical line
- Channel
- Rectangle
- Fibonacci retracement
- Volume profile
- Text
- Magnet
Like the main panel, the Drawing panel can be dragged to any edge of the chart window — see Moving the panel.
Object kinds
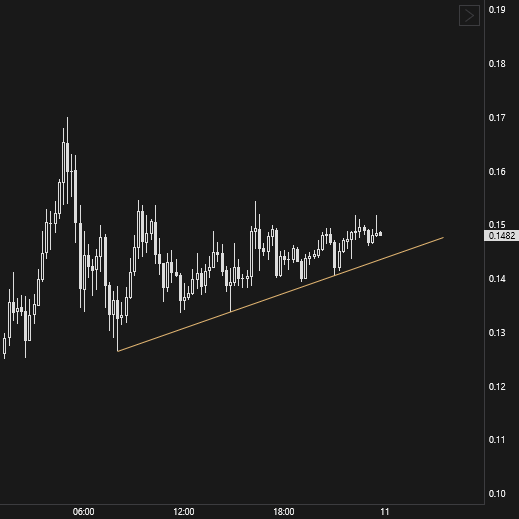
Trend line
A segment between two points. In the settings it can be extended to the right and to the left.
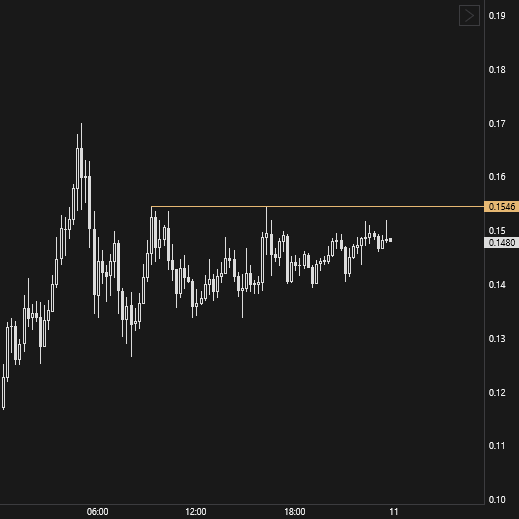
Horizontal ray
A horizontal line from the selected point to the right. The settings set its price and label.
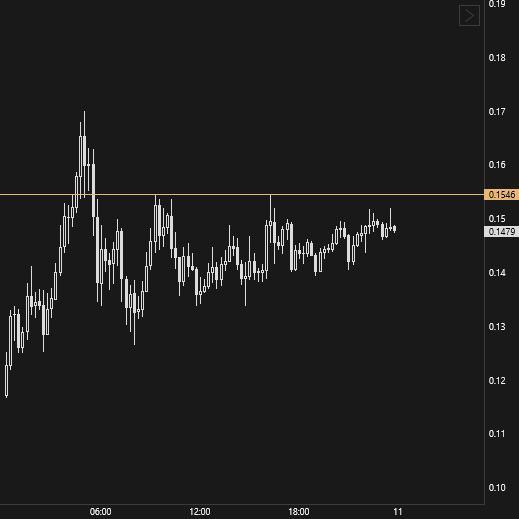
Horizontal line
A horizontal line across the whole width of the chart. The settings set its price and label.
Vertical line
A vertical line marking a point in time.
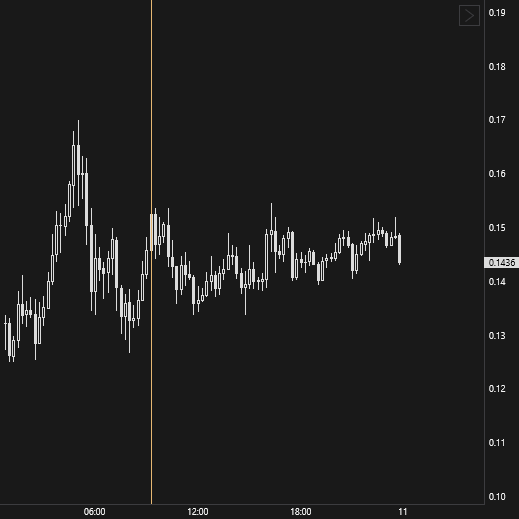
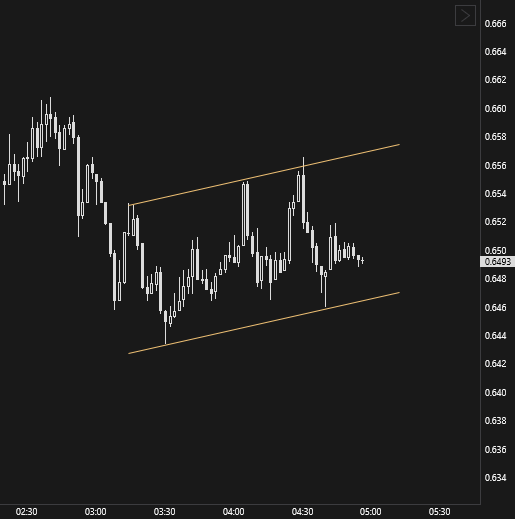
Channel
Two parallel lines. In the settings the channel can be extended to the right and to the left.
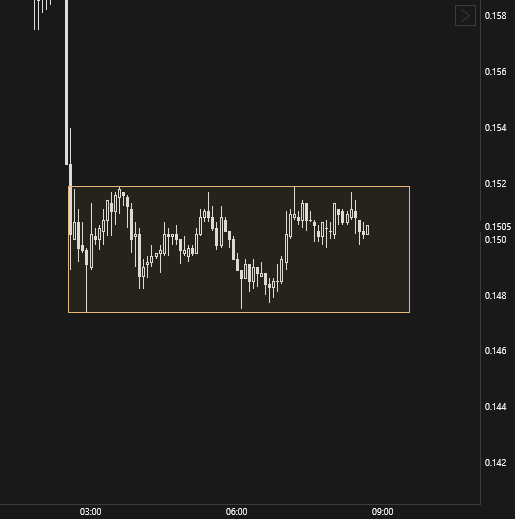
Rectangle
A rectangular area with a configurable border and background.
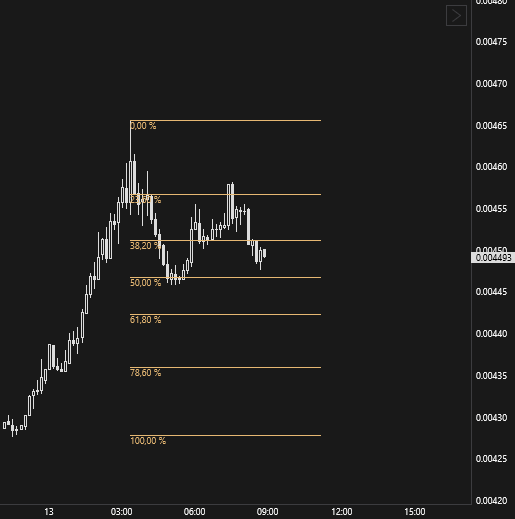
Fibonacci retracement
Fibonacci retracement levels between two points. In the settings the levels can be extended to the right and to the left.
Volume profile
Volume distribution by price in the selected rectangular area of the chart: the profile, the POC (the price with the largest volume), the value area bounds and, optionally, the volume nodes and gaps.
Bars that have clusters go into the profile exactly — with the buys and sells at each price. Other bars are estimated from the candle: their volume is split equally between the prices from the low to the high. At the bottom of the range are the totals: the volume (V), the delta (Δ) and, if some bars have no clusters, how many of them are estimated — “estimated from candles: 3 of 120”. The clusters for the profile are loaded in any chart view.
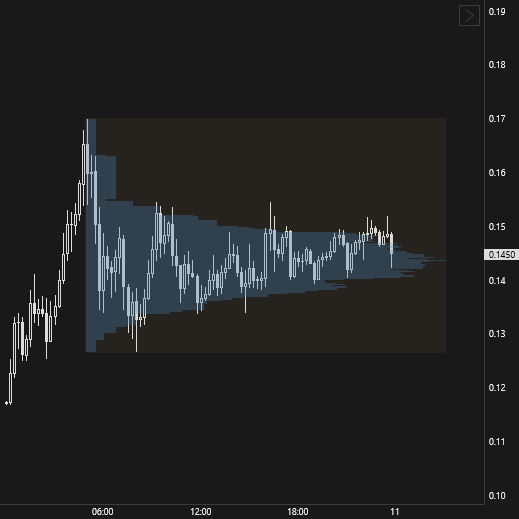
The profile settings are in the object manager, besides the common Border and Background groups:
| Parameter | Description |
|---|---|
| Profile view | Volume (default) — volume by price in one color; Buys and sells — buys (Ask) and sells (Bid) in the rise and fall colors; Delta — delta by price. Trade sides come only from bars with clusters; the estimate from candles is gray and left out of the delta. |
| Profile color | The color of the profile bars in the Volume view. |
| Price steps per row | How many price steps of the chart add up to one row of the profile: 1 to 1000, 1 by default. |
| Extend to new bars | The profile runs from the left point to the last bar of the chart; new bars join it on their own. Off by default. |
| Totals | At the bottom of the range — the volume and delta; if some bars have no clusters — how many are estimated from candles. On by default. |
| POC | A line at the price with the largest volume across the range. On by default. |
| POC to the right edge | The POC line goes on to the right edge of the chart. Shown when POC is on. Off by default. |
| Value area | Dashes at the upper (VAH) and lower (VAL) bounds of the value area. On by default. |
| Value area, % | The share of the profile volume in the value area: 10 to 100, 70 by default. Shown when the value area is on. |
| Volume nodes and gaps | Volume nodes (HVN, a solid line) are the prices around which most was traded (the price gets stuck there), gaps (LVN, dots) are the prices the market passed quickly (it slips through there). Found on the smoothed profile. Off by default. |
| Nodes: smoothing, % | The smoothing width (σ) in percent of the profile height: more — fewer and larger nodes. 1 to 10, 2 by default. Shown with the nodes on. |
| Nodes: prominence, σ | A node or a gap stands out from the neighbouring saddle by at least so many standard deviations of the smoothed profile: more — only the clear ones. 0.25 to 3, 0.5 by default. Shown with the nodes on. |
The color of the POC, the value area and the nodes and gaps is Volume profile drawing POC color in the Volume analysis group of the chart theme.
Text
A text label on the chart with configurable color, size, border and background.