Footprint
Footprint is a chart view in which a bar is split into price rows, and each row shows how much was bought and sold at that price by aggressive trades. The footprint shows where inside the bar the main volume traded, which side was more active — buyers or sellers — and at which prices one side heavily outweighed the other.
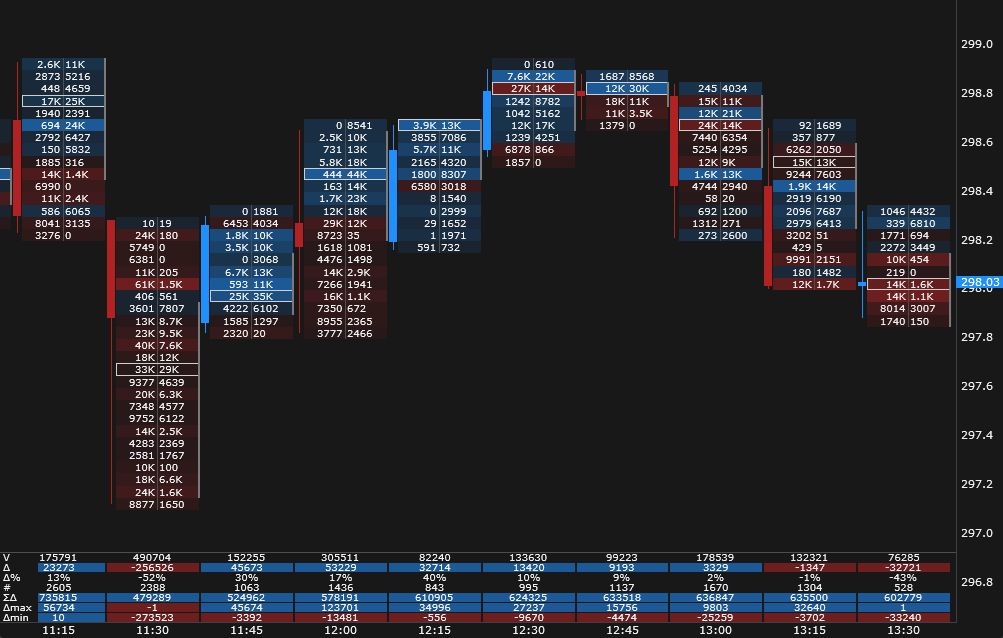
Indicators, drawing objects, alert levels, chart trading, scales and scrolling work as with candles: only the way the bars are drawn changes.
Some footprint features work in any chart view, candles included: past day levels, cluster search, large trades and sweeps and the alerts. They are turned on on the same Clusters settings tab.
Turning it on
Click the Chart type icon on the main panel and choose Footprint. The Footprint presets submenu of the same menu holds ready sets of settings and your own presets: choosing a preset turns the Footprint view on at once. The last item of the submenu is Footprint builder…: a window where you see the settings on a sample chart right away.
When you turn the footprint on, narrow bars widen so that the numbers fit; when you turn it off, they return to the width of the normal view.
Data
The footprint is built from trades. The cluster history comes from the JetScalp server, then the bars are filled with real-time trades.
- The last bars have clusters — their number is set by Cluster history bars (1500 by default). Older bars are drawn as plain candles.
- If there is no cluster history, a note appears at the bottom of the chart: the history is loading, unavailable or not requested (no connection to the server). The bars are then built from the trades since the window was opened.
- The side of a trade is the one the exchange reports: a buy if the aggressor bought (a trade at the ask), a sell if it sold (at the bid).
In other chart views the clusters are loaded too when something needs them: zone alerts, cluster search, the bar signals alert, or a Volume profile object on the chart. The past day levels and the past days profile need day clusters — the terminal requests them from the server separately.
Trade history
Some features are built not from clusters but from individual trades: large trades and sweeps, the Trades, Volume and trades, Average trade and ΔOI cell modes, the Δmax and Δmin, ΔOI, Ask/# and Bid/# statistics rows. For them the terminal takes from the JetScalp server the trades of the current day and of as many past trading days as set by Trade history: past days (0 by default — the current day only, up to 14). After the first load, past days come from the cache on disk. Then the trades that reach the window are added to the history.
Bars before the first trade of the history have no such data: the cells of the trade-based modes are empty (the POC, value area and auctions stay), and the trade-based statistics rows are blank. If the server returned no trade history, all of this is built from the trades since the window was opened.
What a bar shows
| Element | Description |
|---|---|
| Cells | The price rows of the bar. What a cell says is set by Cell mode. The row height is Cluster step, ticks. |
| Tint | The cell background — by the row delta (buys minus sells) or by its volume. |
| Candle | A narrow candle at the left edge of the bar: open, high, low, close. |
| Bar POC | A frame around the row with the largest volume of the bar. If there are several such rows — the lowest one. With Bar POC by the frame can go at the largest buys or sells, or at the largest or the smallest delta. |
| Bar value area | A line at the right edge of the bar from VAL to VAH — the price range where the set share of the bar volume traded (70 % by default). |
| Buyers’ and sellers’ VWAP | Two ticks at the left edge of the bar: the average price of the aggressive buys — in the buy color, of the aggressive sells — in the sell color. Turned on with Buyers’ and sellers’ VWAP. |
| Imbalances | The number of the side that outweighed — in bold, in that side’s color. A stacked imbalance — a bar at the right edge of its rows. |
| Unfinished auction | A tick at the bar’s high or low if both buys and sells traded at that price. |
| Bar signals | Marks at closed bars above the high and below the low (Bar signals). |
| Statistics below bars | A table below the bars: volume, delta, delta percent, the number of trades and the day’s cumulative delta, plus optional rows (Profile and statistics). |
Hover over a bar — the legend shows the bar’s open, high, low and close, its volume (V), delta (Δ), delta percent and number of trades (#), and for the row under the cursor — sells × buys and the delta. When the data are there, the legend adds:
- Δmax and Δmin — the largest and the smallest cumulative delta during the bar;
- from the trade history: the bar’s ΔOI and, in parentheses, the “off tape” part — the change of open interest that does not fit the bar’s trades (negotiated deals); avg trade — the average sell × buy trade; for the row under the cursor — the number of its trades, the average trade and ΔOI;
- ΔVWAP — the side VWAP gap in price steps, if the VWAP ticks or the ΔVWAP statistics row are on;
- the names of the bar’s signals, if the Bar signals marks are on.
At a small zoom the numbers no longer fit, and the view simplifies itself: first the cells become the mode’s histogram or heatmap, then the bars are drawn as candles. The POC frame, the value area line and the auction ticks are visible only close up. A long number is shortened: 1,100 becomes “1.1K”, then “1K”; if it still does not fit, it is not written.
Cell modes
Most modes are built from the same clusters: switching between them does not request the history again. The Trades, Volume and trades, Average trade and ΔOI modes are built from the trade history: bars before it have no cells.
| Mode | What a cell shows |
|---|---|
| Bid × Ask | Two columns: sells (at the bid) on the left, buys (at the ask) on the right. |
| Bid × Ask ladder | As Bid × Ask, but only the side that prevails in the row by delta is tinted. |
| Volume | The row volume and a volume histogram. |
| Delta | Buys minus sells. |
| Delta, % | The delta as a percent of the row volume. |
| Volume and delta | The row volume and delta. |
| Trades | The number of trades in the row. |
| Volume and trades | The row volume on the left, the number of its trades on the right. |
| Average trade | Two columns, as in Bid × Ask: the average sell trade on the left, the average buy trade on the right (the side’s volume divided by the number of its trades). A large average trade points to a large participant at the price. Each half is tinted in its side’s color by the size of the average. |
| ΔOI | The signed change of open interest from the row’s trades; the tint goes by it. Open interest comes with MOEX trades; without it there are no cells. |
| Bid × Ask histogram | Bars without numbers from the middle of the bar: sells to the left, buys to the right. |
| Volume profile | Bars of the row volumes without numbers. |
| Delta profile | Bars of the absolute row deltas without numbers, in the color of the delta sign. |
| Heatmap | Cells by color only: by the row delta or volume — as set in Cell background. |
Presets
A preset is a ready set: it rewrites the cell mode, tint, POC, value area, imbalances and auctions, profile and statistics. The thresholds and the history depth stay yours. Choose a preset in Chart type → Footprint presets or with the Preset parameter in the settings. Choosing the same preset again restores its set if you have changed the settings.
| Preset | Cells | Tint | POC | Value area | Imbalances and auctions | Profile on the right | Statistics |
|---|---|---|---|---|---|---|---|
| Classic footprint | volume | by delta | yes | yes | no | no | yes |
| Bid × Ask (default) | Bid × Ask | by delta | yes | yes | yes | no | yes |
| Delta analysis | delta | by delta | yes | no | no | no | yes |
| Volume profile | volume profile | by delta | yes | yes | no | visible range | no |
| Imbalance | Bid × Ask | none | yes | no | yes | no | yes |
| Compact | heatmap | by volume | yes | no | no | no | no |
Your own presets
Your own preset keeps all footprint settings: the layers, thresholds, search conditions and large trade parameters. Alerts (check boxes and sounds) and the Data group are not part of it — they stay with the chart window. Your own presets are created and changed in the footprint builder.
Your own presets are shared by all charts. In the Chart type → Footprint presets menu they follow the built-in ones after a separator; the preset of this window has a check mark. Choosing your own preset turns the Footprint view on, and the Preset parameter in the settings shows Custom. The presets are stored next to the chart templates and are synced together with them.
Footprint builder
The footprint builder is a window where you see the footprint settings on a sample chart right away. Open it in one of these ways:
- choose Chart type → Footprint presets → Footprint builder…;
- click Footprint builder… at the bottom of the Clusters tab of the chart settings window.
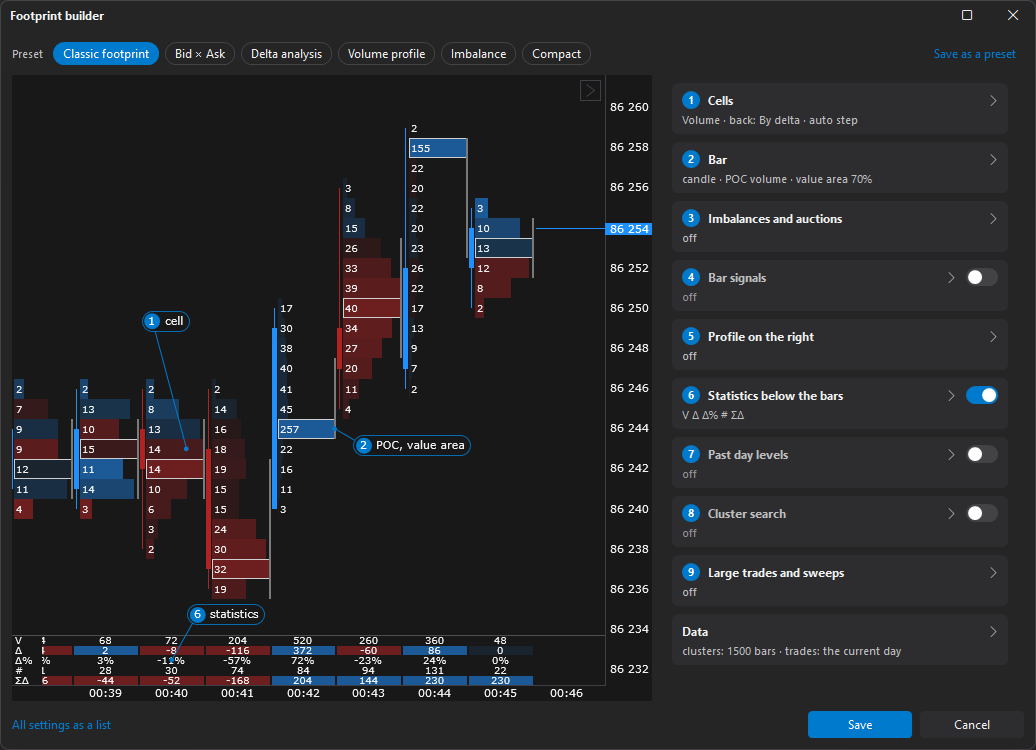
At the top is the preset row: the built-in presets and, after a separator, your own. The chosen one is highlighted, and if the settings have changed since it was chosen, it is marked with a dot. Clicking a preset applies it; clicking it again restores its settings.
On the left is the sample: a real chart in the Footprint view on prepared trades of a MOEX minute future, with your settings. It has numbered callouts: 1 — cell, 2 — POC and value area, 3 — imbalances and zone, 4 — bar signal, 5 — profile, 6 — statistics, 7 — past day level, 8 — found cluster, 9 — large trade or sweep. The sample redraws after every change.
On the right are the settings as cards with the same numbers: Cells, Bar, Imbalances and auctions, Bar signals, Profile on the right, Statistics below the bars, Past day levels, Cluster search, Large trades and sweeps and, last, Data. One card is open at a time: clicking its header opens or closes it, and a closed card shows a short summary. On some cards a switch in the header turns the whole layer on. Inside are the main parameters, the collapsed Thresholds section and the Alerts section; a closed card with an alert on is marked “alert”. Hover over a card — its callout is highlighted on the sample, and vice versa; clicking a callout opens its card.
The window’s buttons:
- Save as a preset — save the current settings as your own preset: the terminal asks for a name, and if it already exists — “A preset with this name already exists. Overwrite it?”;
- Update ”…” — write the changes into the chosen own preset (the button shows when it has changed);
- All settings as a list — the same settings as a list, as on the Clusters tab; back — Cards;
- Save — apply the settings to the chart window. If the builder was opened from the Chart type menu, the chart switches to the Footprint view;
- Cancel or Esc — close without changes.
Right-click your own preset in the preset row for a menu: Apply, Update from the current, Rename…, Duplicate, Delete.
Imbalances and auctions
Diagonal imbalance — the buys of a row are compared with the sells of the row below, and the sells of a row with the buys of the row above. If one side is at least the threshold of the other (300 % by default, that is three times as much), it is an imbalance. The lowest row of a bar has no row below, so it never has a buy imbalance; the highest row never has a sell imbalance.
Stacked imbalance — several imbalances of one side in rows in a row (three or more by default). A buy stack often becomes support, a sell stack — resistance.
Unfinished auction — both buys and sells traded at the bar’s high (low): the auction at that price is not finished, and price often returns to it.
Zones until touched
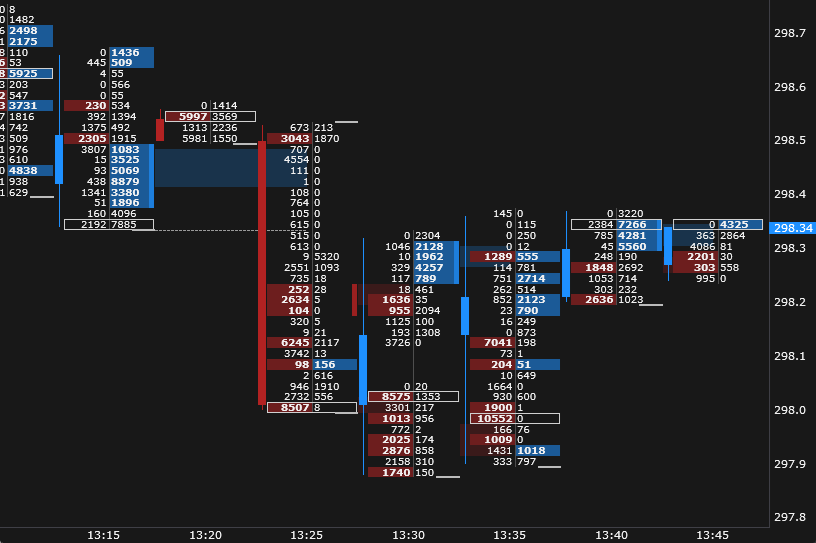
Stacked imbalances and unfinished auctions of closed bars extend to the right until price returns to them: a stack — as a band in its side’s color, an auction — as a dashed line at its price. When price returns, the line ends at the touching bar. Zones are drawn only for the marks that are on: stacks with Diagonal imbalances on, auctions with Unfinished auctions on.
Zones are computed with the cluster step of the settings, and with the “auto” step — with the symbol’s price step, so they do not change with the chart zoom.
Zone alerts
The terminal can give an alert:
- Alert: new zone — a bar with a stacked imbalance or an unfinished auction has closed;
- Alert: price returned to a zone — price first returned to a stack or an unfinished auction. The alert comes at once, not at the bar close.
The alerts go to the Notifications window with the source Footprint, for example “Stacked buy imbalance … (bar 15:47)”, and play the sound of Zone alerts sound (None — silent). The time in the text is the bar time by the exchange clock. The alerts also work in other chart views and in a minimized window: it is enough to turn them on in the footprint settings. There are no alerts about bars that closed before the window was opened or before the alert was turned on.
Tip: With the default thresholds there are many stacks a day — the new zone alert on an active symbol may sound several times a minute. For alerts, raise Imbalance from volume or Stacked imbalance, rows.
Bar signals
Turned on with Bar signals. The marks appear only at closed bars: the forming bar has none, so a signal does not flicker while the bar forms. While there are fewer previous bars than the window, there are no signals.
A new high (low) means the bar is above (below) as many previous bars as set by New extreme: window, bars (5 by default). Divergence, exhaustion and absorption are checked on it.
| Signal | Mark | When it appears |
|---|---|---|
| Anomalous volume | A square above the high | The bar volume is at least the window mean plus as many standard deviations as the threshold (by default a 20-bar window and a 2.5 σ threshold). |
| Anomalous delta | A circle in the color of the delta sign above the high | The same for the absolute bar delta. |
| Bearish delta divergence | A triangle above the high | A new high, and the bar delta is negative. |
| Bullish delta divergence | A triangle below the low | A new low, and the bar delta is positive. |
| Buying exhaustion at the high | A ring in the sell color above the high | A new high, the buys of the top three rows fall towards the high, and the top row’s volume is at most the set share of the median row volume of the bar (50 % by default): the move to the high went on ever smaller buys. |
| Selling exhaustion at the low | A ring in the buy color below the low | The same at a new low for the sells of the bottom three rows. |
| Buying absorbed at the high | A bar in the sell color above the high | A new high, and among the top rows (two by default) there is a row whose volume is at least the mean row volume of the bar plus as many standard deviations as the threshold (2.5 σ by default), with more buys than sells, and the bar closed below it: a seller met the buys. |
| Selling absorbed at the low | A bar in the buy color below the low | The same at a new low: more sells than buys, the bar closed above the row. |
Exhaustion and absorption are computed on rows of the cluster step of the settings (with the “auto” step — the price step) and only for bars of at least six rows. They formalize a footprint reading practice rather than being a researched indicator; see the tutorial: Absorption and exhaustion. Each of the two can be turned off: Signal: exhaustion, Signal: absorption.
If a bar has several marks, they go outwards from the bar: above the high — volume, delta, absorption, exhaustion, divergence; below the low — absorption, exhaustion, divergence. Hover over a bar — the legend shows the names of its signals.
Alert: bar signals gives an alert when a bar with any of these signals closes — by the same thresholds. The alert works in any chart view and in a hidden window, and the marks on the chart need not be on for it. It goes to the Notifications window with the source Footprint, for example “Anomalous volume, bearish delta divergence (bar 15:47)” or “Buying absorbed at the high (bar 15:47)”, and plays the sound of Signal alerts sound.
Profile and statistics
Profile on the right — a volume profile at the right edge of the chart: of the visible cluster bars, of the current day, or of past days together with the current day. How many past days go into the profile is set by Past days in the Past day levels group. Its value area is brighter, the POC is framed.
Volume nodes and gaps on the right profile: nodes (HVN) are a solid line — the prices around which most was traded, where price usually gets stuck; gaps (LVN) are dots — the prices the market passed quickly, where price usually slips through. They are found on the smoothed profile: Nodes: smoothing, % sets the smoothing width, Nodes: prominence, σ — how much a node or a gap must stand out. The outermost rows of the profile are never nodes or gaps.
Developing day POC — a stepped line: where the day’s POC was as of the close of each bar.
Statistics below bars — a table below the bars; the price autoscale leaves room for it. It always has the rows V (volume), Δ (delta), Δ% (delta in percent of the volume), # (the number of trades) and ΣΔ (cumulative delta from the start of the day). Extra rows are turned on separately:
| Row | Description |
|---|---|
| Δmax, Δmin | The largest and the smallest cumulative delta during the bar — after each trade (no zero before the first trade). It needs the order of the bar’s trades — from the trade history and the window’s trades. |
| ΔOI | The change of open interest over the bar (at MOEX open interest comes with each trade), from the trade history. |
| Ask/#, Bid/# | The average buy and sell trade: the side’s volume divided by the number of its trades, from the trade history. The larger one is tinted in its side’s color — the stronger, the larger the skew. |
| Δtop, Δbot | The delta of the bar’s top and bottom rows in percent of the bar volume; how many rows — Edge delta: rows. A new high with a negative Δtop — sellers meet the buyers at the top, a new low with a positive Δbot — buyers meet the sellers at the bottom. The rows use the cluster step of the settings, with the “auto” step — the price step. |
| ΔVWAP | The average price of the aggressive buys minus that of the aggressive sells, in price steps. It is usually positive: buys go at the ask, sells at the bid. Zero and below — the sellers hit higher than the buyers took. |
Bars before the trade history have blank trade-based rows.
A day is a calendar day by the trade time: for MOEX — Moscow time.
Past day levels
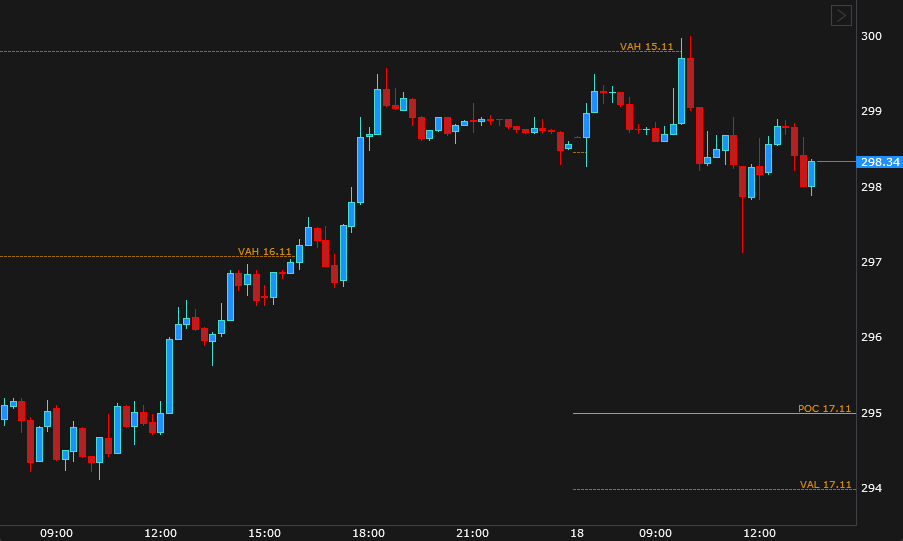
Past day levels are the POC of past trading days and, with VAH and VAL on, the bounds of their value area, drawn as lines on the chart. The levels show in any chart view. The data are the JetScalp server’s day clusters, up to 14 past trading days; days without trades do not count.
- The POC is a solid line, VAH and VAL are dashed. The line color is Past day levels color in the chart theme.
- A line starts after its day and is labeled with the day, for example “POC 11.11”.
- With Lines until price touches on, a line ends at the bar where price first traded at it after its day. A touch is a trade at the level’s price: if price jumped over the level in a gap without trades, the level is not touched. Untouched levels reach the right edge.
- A day becomes past when a new day starts by the exchange clock: in the morning before the first trade, yesterday’s levels are already shown.
- The level rows use the cluster step of the settings, with the “auto” step — the symbol’s price step. The value area share is Value area, %.
If there is no day history, a note appears at the bottom of the chart: “Past day levels: loading history”, “Past day levels: no history — only days that passed whole with the window open” or “Past day levels: history not requested (no server connection)”.
Alert: price reached a level gives an alert when price first trades at a level after its day: at the POC, and with VAH and VAL — at them too. The alert comes at once, once per level, in any chart view and in a hidden window. In the Notifications window the source is Footprint and the text is like “Price reached POC 11.11: 84 150 (10:05:12)”, with the trade time in parentheses.
Cluster search
Cluster search marks the places on the chart that meet the conditions you set: for example, a volume of 500 lots or more at the bar’s high, or sells prevailing in the body of a rising bar. The search works in any chart view: on footprint bars with cells a match is framed, in other views it is a circle whose size depends on the value. The mark color depends on what is searched: volume and POC, buys, sells (delta — by its sign); the colors are set in the chart theme.
How a condition is set:
- Search for — the window’s volume, buys, sells or delta; POC (largest volume) — the window with the largest volume in the bar. For the delta, Delta sign keeps only buys or only sells prevailing.
- A window is several rows (Merge rows) of one or several bars in a row (Merge bars): their values add up.
- The threshold is From and To in the symbol’s lots or contracts, Auto threshold, σ — without lots, by the statistics of the windows of previous bars, and Share of bar volume from, %. For the delta its absolute value is compared.
- Location in the bar and Bar direction narrow where and in which bars to search.
The search runs over closed bars with clusters; with Forming bar — over the unclosed bar too, where a mark may come and go before the bar closes. The search rows use the cluster step of the settings, with the “auto” step — the symbol’s price step.
Alert: cluster found gives an alert about a bar with a match when the bar closes, and with Forming bar — at the first match. The alert works in any chart view and in a hidden window. In the Notifications window the source is Footprint and the text is like “Cluster: volume 1 250 at 86 300 – 86 302 (bars 15:45–15:47, 2 more)”: the largest match, its prices, the window’s bars and how many more matches the bar has. For an unclosed bar, “bar not closed” is added at the end.
Large trades
Large trades are circles on the price chart in any chart view: the circle size is by volume, the color — a buy or a sell, the place — the order’s average price. A vertical line through the circle shows the prices the order went through, and the volume is written inside the circle when it fits. The colors are Large buys color and Large sells color in the chart theme.
- With Join the trades of an order on, trades of one side in a row with one time are one order, as on the order book tape: a large order that went through several prices is one circle. Joining window, ms also adds trades within that many milliseconds of the first one.
- Threshold — from how many lots (contracts) an order is large. With 0 the threshold is automatic: the order is that many times the average trade (Auto: times the average trade), and the average trade is the volume of the bars before the order’s bar divided by their trade count (Auto: average over bars).
- The trades come from the trade history: from the server for the current day and the set number of past days, then the window’s trades. A vertical dashed line labeled “large trades since …” with the time marks the bar from which the window sees trades, if there are bars without them to its left on screen. If the server returned no trade history, circles exist only for trades since the window opened.
- The threshold is shared by the circles, the sweeps and the LargeTradesDelta indicator.
Alert: large trade gives an alert when an order reaches the threshold — once per order, in a hidden window too. In the Notifications window the source is Chart and the text is like “Large trade: buy 250 at 86 300 (3 trades, 86 298 – 86 302), 15:47:12”: the volume, the average price, the number of trades and their price range, the time of the first trade.
Sweeps
A sweep is an order that went through several prices at one stroke. In any chart view it is drawn as a vertical line over the order’s prices to the right of its bar, with an arrow towards the aggressor: up for a buy, down for a sell. The colors are those of the large trade circles. Turned on with Sweeps.
An order is a sweep if it went through at least Sweep: from price levels price steps (from its lowest to its highest trade price inclusive, 5 by default) and its volume is at least Sweep: volume from, % of the threshold of the large trade threshold (25 % by default). Without the volume condition there are too many sweeps: an active MOEX future has thousands of orders a day over three prices or more. A large order with the circles on is drawn as a circle with a line, with no separate sweep mark.
Alert: sweep gives an alert when an order becomes a sweep — once, in a hidden window too. An order that already had a large trade alert gets no sweep alert. In the Notifications window the source is Chart and the text is like “Sweep: buy 120 through 6 levels, 86 298 – 86 303 (9 trades), 15:47:12”: the volume, how many price levels the order went through, the price range, the number of trades and the time of the first trade. The sound is shared with large trades: Large trade and sweep alerts sound.
Settings
The footprint settings are on the Clusters tab of the chart settings window. Each chart has its own, and they are saved in the chart template. Changes show on the chart at once; a new history depth is requested after the settings window closes. Dependent parameters are always listed but unavailable until the parameter they belong to is on: imbalance thresholds — with imbalances on, signal parameters — with signals on, search conditions — with search on, and so on. The Footprint builder… button at the bottom of the tab opens the footprint builder — the same settings on a sample chart.
The sound of any alert is one of Sound 1…Sound 7 (Sound 1 by default); None — silent, the Notifications window only.
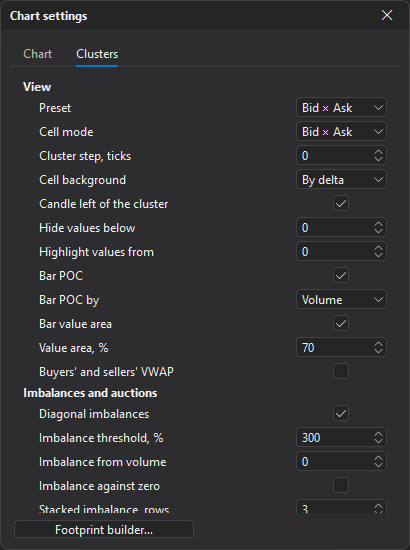
View
| Parameter | Description |
|---|---|
| Preset | A ready set: choosing it rewrites the cell mode, tint, marks, profile and statistics; thresholds stay. Bid × Ask by default. With your own preset chosen — Custom. |
| Cell mode | What a cell shows: Bid × Ask, Bid × Ask ladder, volume, delta, delta percent, volume and delta, trades, volume and trades, average trade, ΔOI, histograms, heatmap (Cell modes). |
| Cluster step, ticks | Price steps per cluster row: 0 to 1000. 0 — automatic by zoom: the step is chosen from round values (1, 2, 5, 10, 20, 25, 50…) so that the numbers are never smaller than the font. 0 by default. |
| Cell background | Cell tint: By delta of the row (default), By volume of the row or None. |
| Candle left of the cluster | A narrow candle at the left edge of the bar. On by default. |
| Hide values below | Cells with a volume below this number show no value (in the symbol’s lots or contracts). 0 — show all. |
| Highlight values from | Cells with at least this volume are bold. 0 — none. |
| Bar POC | A frame around the row with the largest volume of the bar. On by default. |
| Bar POC by | What the frame goes by: Volume (default), Buys (Ask), Sells (Bid) — the largest in the bar, Delta + — the largest delta, Delta − — the smallest; of equal rows — the lowest. The value area, the profile and the past day levels always go by volume. |
| Bar value area | A line from VAL to VAH at the right edge of the bar. On by default. |
| Value area, % | The share of the volume in the value area of the bar, the profile on the right and the day of the past day levels: 10 to 100, 70 by default. |
| Buyers’ and sellers’ VWAP | Two ticks at the left edge of the bar: the average price of the aggressive buys (buy color) and of the aggressive sells (sell color). Buys above sells are usual: buys go at the ask; sells above buys — the sellers hit higher than the buyers took. Off by default. |
Imbalances and auctions
| Parameter | Description |
|---|---|
| Diagonal imbalances | Buys of a row against sells of the row below and sells against buys of the row above, when one side is at least the threshold, are colored. On by default. |
| Imbalance threshold, % | How many percent of the opposite side the side must be: 300 — three times as much. From 110, 300 by default. |
| Imbalance from volume | A smaller volume of the dominant side is not an imbalance (lots, contracts). 0 — any. |
| Imbalance against zero | The opposite side is empty: on — it is an imbalance if the volume is at least Imbalance from volume; off — it is not. Off by default. |
| Stacked imbalance, rows | So many imbalances of one side in a row are a stack: 2 to 20, 3 by default. |
| Unfinished auctions | A mark at the bar’s high (low) when both buys and sells traded there. On by default. |
| Zones until price returns | Stacked imbalances and unfinished auctions of closed bars extend to the right until price returns to them (Zones until touched). On by default. |
| Alert: new zone | An alert when a bar with a stacked imbalance or an unfinished auction closes. Off by default. |
| Alert: price returned to a zone | An alert when price first returns to a stack or an unfinished auction — at once, not at the bar close. Off by default. |
| Zone alerts sound | The sound of zone alerts. Sound 1 by default. |
| Bar signals | Anomalous volume and delta, delta divergence, exhaustion and absorption at the extreme — marks at closed bars (Bar signals). Off by default. |
| Alert: bar signals | An alert when a bar with an anomalous volume, an anomalous delta, a divergence, exhaustion or absorption closes (by the thresholds below) — without the “Bar signals” marks too, in any chart view and in a hidden window. Off by default. |
| Signal alerts sound | The sound of bar signal alerts; None — silent, the alert goes to the Notifications window only. Available when the alert is on. Sound 1 by default. |
| Anomaly: window, bars | How many previous bars give the mean and spread; with fewer bars there are no signals: 5 to 500, 20 by default. This and the following thresholds are shared by the marks and the alert and are available when Bar signals or Alert: bar signals is on. |
| Anomaly: threshold, σ | The bar volume (absolute delta) is at least the window mean plus so many standard deviations: 1 to 10, 2.5 by default. |
| New extreme: window, bars | A new high (low) is above (below) so many previous bars. A divergence is a new extreme with the delta against the move; exhaustion and absorption — only at a new extreme. 1 to 100, 5 by default. |
| Signal: exhaustion | A new high, while the buys over the top three rows fall towards the high and the top row’s volume is small (the threshold below) — buyers run out; at the low — the same for the sells. The bar needs at least 6 rows. On by default. |
| Exhaustion: edge, % of median | The outermost row’s volume is at most so many percent of the median row volume of the bar (50 — half a usual row): 5 to 100, 50 by default. Available with exhaustion on. |
| Signal: absorption | A new high, while one of the top rows has an anomalous volume with the buys prevailing, and the bar closed below it: a seller absorbed the buys; at the low — the same for the sells. The bar needs at least 6 rows. On by default. |
| Absorption: threshold, σ | The row volume is at least the mean row volume of the bar plus so many standard deviations: 1 to 10, 2.5 by default. Available with absorption on. |
| Absorption: rows at the edge | Among how many outermost rows of the bar (at the high or the low) to look for the absorption row: 1 to 10, 2 by default. |
Profile and statistics
| Parameter | Description |
|---|---|
| Profile on the right | A volume profile at the right edge of the chart: None (default), Visible range — of the visible cluster bars, Current day, Past days and the current day — past days (as many as Past days) together with the current day. |
| Profile width, % | The profile width in percent of the chart width: 5 to 50, 20 by default. |
| Volume nodes and gaps | On the right profile: volume nodes (HVN, a solid line) and gaps (LVN, dots) (Profile and statistics). Available when a profile is chosen. Off by default. |
| Nodes: smoothing, % | The smoothing width (σ) in percent of the profile height: more — fewer and larger nodes. 1 to 10, 2 by default. |
| Nodes: prominence, σ | A node or a gap stands out from the neighbouring saddle by at least so many standard deviations of the smoothed profile: more — only the clear ones. 0.25 to 3, 0.5 by default. |
| Developing day POC | A stepped line of the day’s POC as of the close of each bar. Off by default. |
| Statistics below bars | A table below the bars: volume, delta, delta percent, trades, the day’s cumulative delta. On by default. The following rows are available with the statistics on. |
| Max and Min delta in statistics | The Δmax and Δmin rows: the largest and the smallest cumulative delta during the bar. It needs the trade history: bars before it, and the window’s first bar without it, are blank. Off by default. |
| ΔOI in statistics | The ΔOI row: the change of open interest over the bar (MOEX), from the trade history. Off by default. |
| Average trade in statistics | The Ask/# and Bid/# rows: the average buy and sell trade, the larger one tinted in its side’s color. From the trade history. Off by default. |
| Edge delta in statistics | The Δtop and Δbot rows: the delta of the bar’s top and bottom rows in percent of the bar volume. Off by default. |
| Edge delta: rows | How many of the bar’s outermost rows at the top and at the bottom give Δtop and Δbot: 1 to 10, 2 by default. |
| Side VWAP gap in statistics | The ΔVWAP row: the average price of the aggressive buys minus that of the aggressive sells, in price steps. Off by default. |
Past day levels
| Parameter | Description |
|---|---|
| Past day levels | The POC of past days (and optionally VAH, VAL) as lines in any chart view (Past day levels). Off by default. |
| Past days | How many last trading days show their levels, and how many past days the Past days and the current day profile sums; days without trades do not count. 1 to 14, 1 by default. |
| VAH and VAL | The day’s value area bounds — dashed. Off by default. |
| Lines until price touches | On — a line ends at the bar where price first traded at it after its day, untouched ones reach the right edge; off — all lines reach the right edge. On by default. |
| Alert: price reached a level | An alert when price first trades at a level after its day (the POC, and with VAH and VAL — at them too): at once, once per level, in any chart view and in a hidden window. Off by default. |
| Level alerts sound | The sound of level alerts. Sound 1 by default. |
Cluster search
| Parameter | Description |
|---|---|
| Cluster search | Marks of cells meeting the conditions below in any chart view: a frame of the window over clusters, a circle in other views (Cluster search). Off by default. |
| Search for | The window’s Volume (default), Buys (Ask), Sells (Bid) or Delta; POC (largest volume) — the window with the largest volume in the bar. |
| Delta sign | For the delta only: Any (default), Plus (buys) or Minus (sells). |
| From | The window’s value at least this (delta — its absolute value), in the symbol’s lots or contracts. 0 — no threshold. |
| To | The window’s value at most this (delta — its absolute value). 0 — no limit. |
| Auto threshold, σ | The window’s value (delta — its absolute value) at least the mean plus so many standard deviations over the traded windows of the previous bars — a threshold without lots, for any symbol: 0 to 20, 5 by default. 0 — off; then set From or the bar share. |
| Auto threshold: window, bars | How many previous bars give the mean and spread: 5 to 500, 30 by default. With fewer bars there are no matches. |
| Share of bar volume from, % | The window’s value (delta — its absolute value) at least this share of the volume of the window’s bars: 0 to 100, 0 by default — no filter. On narrow bars (two or three rows) almost any row passes it — better together with a threshold. |
| Merge rows | The window is so many rows in a row, their values add up: 1 to 20, 1 by default. |
| Merge bars | The window is the bar and so many minus one previous bars on the same rows, their values add up: 1 to 20, 1 by default. |
| Location in the bar | Where the window is in the bar: Any (default), At the high, At the low, At the high or low (the window takes its row), In the body (between open and close), In the upper wick, In the lower wick, In any wick. |
| Bar direction | Any (default), Rising (close above open) or Falling. |
| One match per bar | On — only the largest match of a bar; off — all of them, the largest of overlapping ones. On by default. |
| Forming bar | Search the unclosed bar too: a mark may come and go before it closes, the alert — at the first match. Off by default. |
| Alert: cluster found | An alert about a bar with a match (the largest and how many more) — when the bar closes, with Forming bar — at the first match; in any chart view and in a hidden window. Off by default. |
| Search alerts sound | The sound of search alerts. Sound 1 by default. |
Large trades
| Parameter | Description |
|---|---|
| Large trades | Circles on the chart in any view: the size by volume, the color — a buy or a sell, the place — the order’s average price (Large trades). Off by default. |
| Sweeps | Orders that went through several prices at one stroke: a line over the order’s prices with an arrow towards the aggressor, in any chart view (Sweeps). Off by default. |
| Threshold | A large order — from this many lots (contracts). 0 (default) — auto: this many times the average trade, as set below. The threshold is shared by the circles, the sweeps (their volume is a share of it) and the LargeTradesDelta indicator. |
| Auto: times the average trade | The average trade is the volume of the bars before the order’s bar divided by their trade count: 2 to 100,000, 50 by default. More — fewer large orders. |
| Auto: average over bars | Over how many bars before the order’s bar to take the average trade: 1 to 1000, 30 by default. |
| Join the trades of an order | Trades of one side in a row with one time are one order, as on the order book tape. Changing the joining starts over. On by default. |
| Joining window, ms | 0 — only trades with one time; more — also trades within this many milliseconds of the first one: 0 to 1000, 0 by default. |
| Volume in the circle | The order’s volume inside the circle when it fits. On by default. |
| Sweep: from price levels | A sweep is an order that went through this many price steps or more (from its lowest to its highest trade price inclusive): 2 to 100, 5 by default. |
| Sweep: volume from, % of the threshold | The sweep’s volume is at least this many percent of the large trade threshold: 13 to 100, 25 by default. |
| Alert: large trade | An alert when an order reaches the threshold — once, in a hidden window too. Off by default. |
| Alert: sweep | An alert when an order becomes a sweep — once, in a hidden window too. An order that already had a large trade alert gets no sweep alert. Off by default. |
| Large trade and sweep alerts sound | The sound of large trade and sweep alerts. Sound 1 by default. |
Data
| Parameter | Description |
|---|---|
| Cluster history bars | How many last bars with clusters to request from the server and keep: 100 to 20,000, 1500 by default. Older bars are drawn as plain candles. |
| Trade history: past days | How many past trading days of trades to take from the server together with the current day (Trade history): 0 to 14, 0 by default — the current day only. Past days then come from the cache on disk; a day of an active future is under a megabyte. Available when something uses the trade history: large trades, sweeps, the LargeTradesDelta indicator, trade-based statistics rows or a trade-based cell mode. |