Chart
The Chart window shows a symbol’s price history as candles, bars or a line. It complements the order book: the order book shows the current orders, while the chart shows how the price moved before that, where the levels and volumes were.
The chart offers timeframes from 1 second and up to 20,000 bars of history, a footprint view, more than 40 indicators, drawing objects and alert levels with Telegram notifications. You can also trade from the chart: place orders with the mouse and drag order and position lines, and save the settings you like as templates.
To open the window, select Windows → Chart — the chart opens as a tab in the terminal’s main window.
Window layout
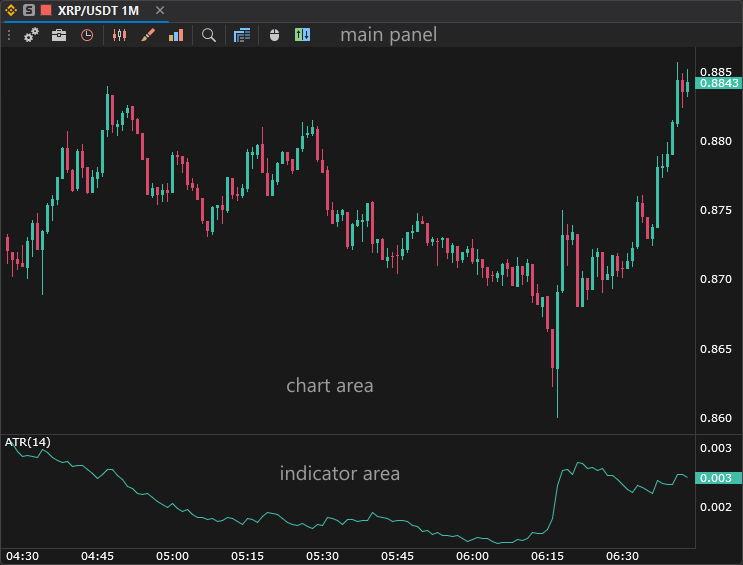
- Main panel — buttons for the symbol and timeframe, chart view, drawing, indicators, settings and templates, plus the chart trading buttons.
- Chart area — price bars, indicators drawn over the price, drawing objects and alert levels. The price scale is on the right, the time scale is at the bottom of the window. Scrolling and zooming are described on the Zooming and moving page.
- Indicator area — indicators drawn separately from the price, for example ATR, RSI or Volume. There can be several such areas.
Besides the main panel, the window has a Drawing panel with drawing object buttons. It is hidden by default.
Context menu
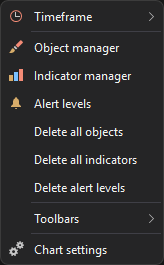
Right-click the chart area to open the context menu. In the menu you switch the timeframe, open the object, indicator and alert levels managers, delete all objects, indicators or levels at once, show and hide the toolbars and open the chart settings.
While no symbol is selected in the window, a right-click opens a short menu with only Chart settings and Toolbars.