Settings
The chart settings define what else to show on the chart besides the bars: the grid, the last price line, the bar close timer, your trades and position. They apply to one chart window.
Opening the window
Open the settings in one of these ways:
- click the Chart settings icon on the main panel;
- right-click anywhere in the chart area and select Chart settings.
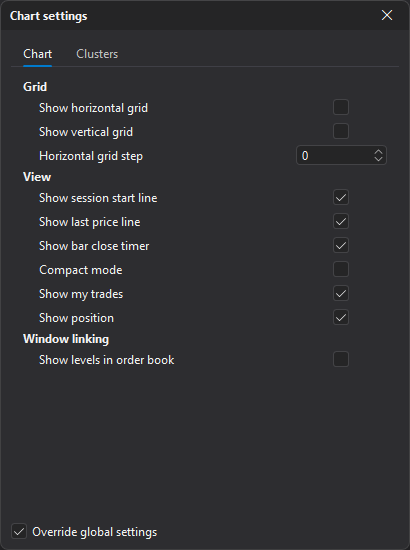
Global and own settings
Some options are taken from the global chart settings by default and are the same for all charts. To set them separately for this window, turn on the Override global settings checkbox at the bottom of the window — the list then shows Show horizontal grid, Show vertical grid, Show session start line, Show last price line and Show bar close timer.
Grid
| Parameter | Description |
|---|---|
| Show horizontal grid | Horizontal lines at equal price intervals. |
| Show vertical grid | Vertical lines at equal time intervals. |
| Horizontal grid step | The distance between the horizontal grid lines in price steps. With 0, the step is calculated automatically from the chart’s vertical zoom. |
View
| Parameter | Description |
|---|---|
| Show session start line | Vertical lines at the start of each session. |
| Show last price line | A horizontal line at the last price of the current bar. |
| Show bar close timer | A countdown timer until the current bar closes. |
| Compact mode | Hides the price and time scales. |
| Show my trades | Your trades on the chart as triangle icons. Trades of the account the chart is bound to are shown, for example through linking with an order book. |
| Show position | Turns on the chart’s trading layer: the lines of your orders, the position with its PnL, the stop loss and take profit with the amount at trigger, and the LIQ liquidation line. You can drag the line labels with the mouse. The orders and position of the account the chart is bound to are shown. With the option off, the chart shows no lines, but a click on the chart still puts the price into the trading panel, and in Mouse trading mode the order buttons still appear at the cursor. |
Compact mode and showing trades can also be toggled with hotkeys — see Chart hotkeys.
Window linking
| Parameter | Description |
|---|---|
| Show levels in order book | Shows the chart’s horizontal levels in the order book linked to it. See Window linking. |
Footprint
The settings of the Footprint view are on a separate Clusters tab of this window: cell mode, imbalances and auctions, bar signals, profile and statistics, past day levels, cluster search, large trades and sweeps, alerts and history depth. The parameters are described in Footprint → Settings.
On the Clusters tab the bottom of the window has the Footprint builder… button instead of the Override global settings check box: it opens the footprint builder, where you see the same settings on a sample chart.
Toolbars
In the chart context menu (right-click the chart area), the Toolbars item shows and hides the main panel (Main toolbar) and the Drawing panel (Drawing toolbar).