Indicator manager
The indicator manager is a window that gathers all indicators of the chart. In it you add and delete indicators, change their parameters (for example, the period of a moving average) and the order of areas, and save settings as templates.
Opening the window
Right-click anywhere in the chart area and select Indicator manager.
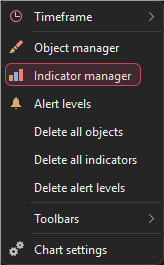
The manager also opens when you double-click an indicator on the chart.
Window layout
The upper left part of the window lists the indicators on the chart, grouped by area (Area 1, Area 2 and so on). The Price indicator is the price chart itself; its area is called the price chart area.
Click an indicator in the list to open its settings in the right part of the window. Changes are shown on the chart right away.
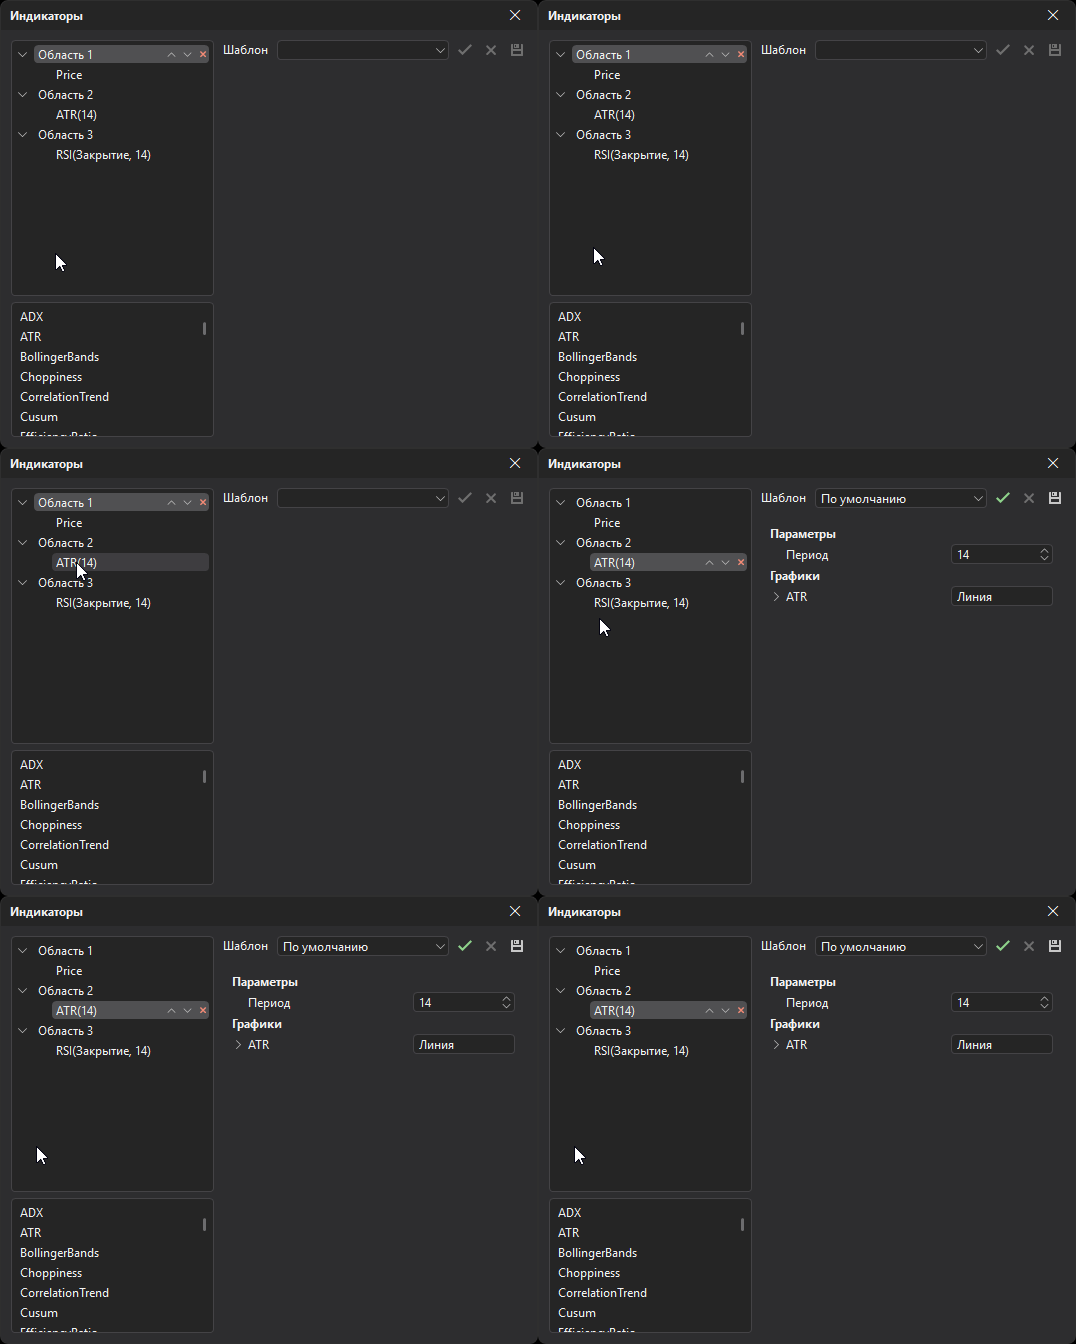
The lower left part of the window lists the indicators available for adding.
The arrow buttons to the right of a name change the order of indicators within an area or the order of the areas themselves.
There is no cancel button: all changes apply to the chart right away.
Price chart settings
Select the Price indicator in the list to set up how the price chart itself is drawn. The chart view — candles, bars or line — is selected with the Chart type button on the main panel.
| Group | Description |
|---|---|
| Last price line | A line from the last bar to the right edge of the chart at its price. Custom color — draw the line in the Line color; with the checkbox off, the line has the color of the last bar. Line style — Solid, Dashes or Dots. |
| Bars | Options of the Bars view. Bar type — OHLC (open and close ticks), HLC (close tick only) or HL (only the line from the low to the high), OHLC by default; the ticks are visible when the bars are wide enough. Bar width — the width of the bar line, 1 to 5, 1 by default. |
| Line | Options of the Line view. Source — which bar price the line is built from: Close, Median (midpoint between the high and the low) or Typical (average of the high, low and close), Close by default. Line width — 1 to 5, 1 by default. |
Adding indicators
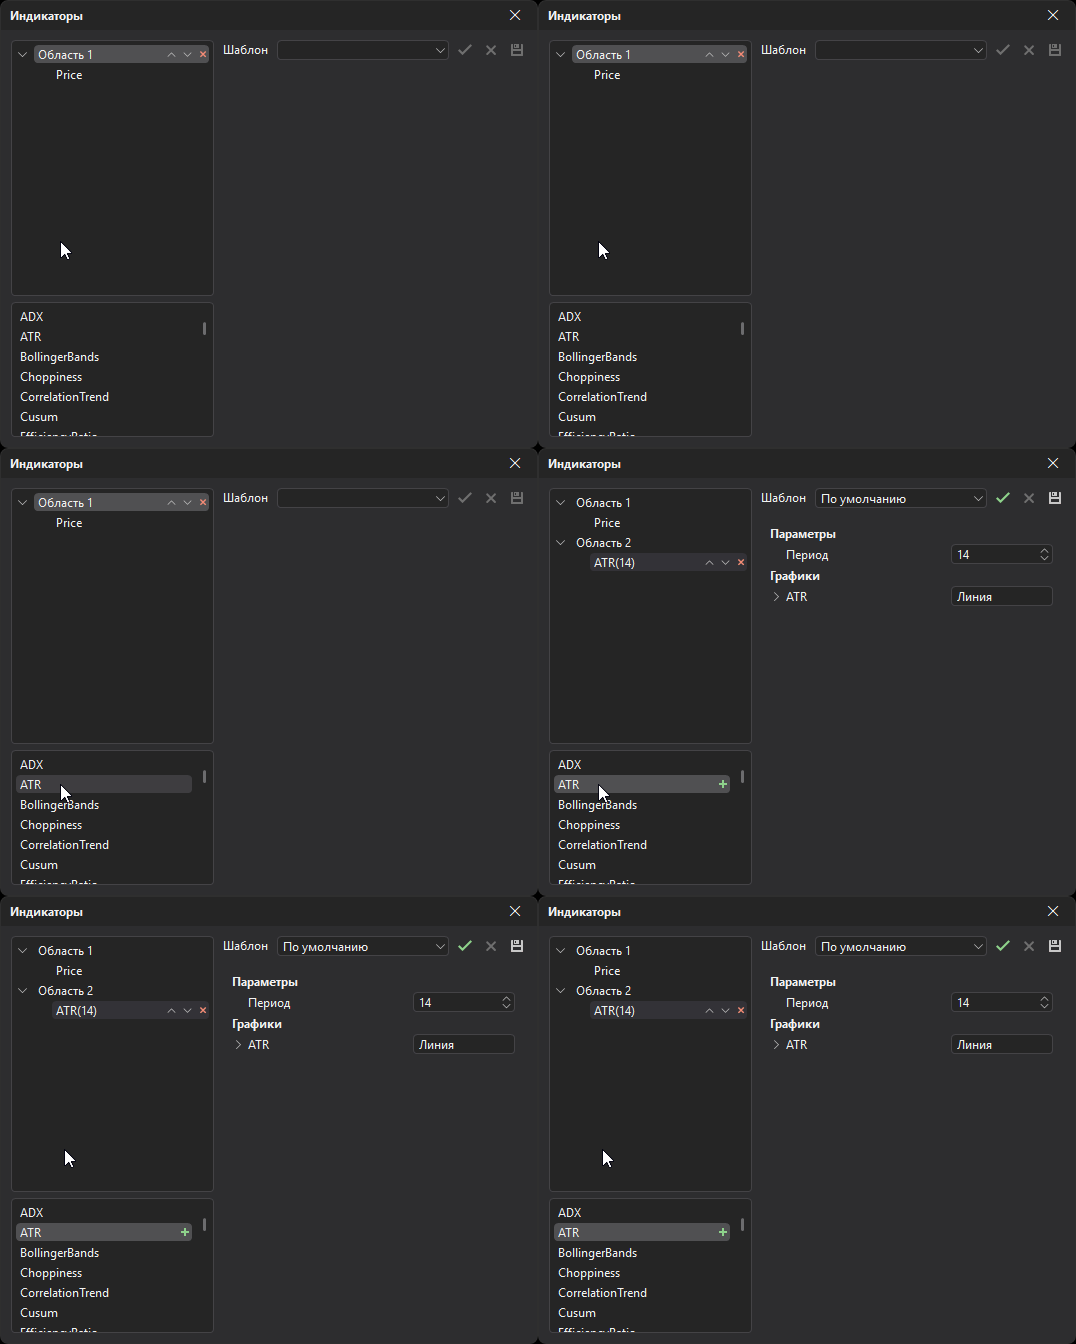
Add an indicator from the list of available ones in one of these ways:
- double-click the indicator name;
- click the button to the right of the indicator name.
The new indicator immediately appears in the list in the upper left part of the window: indicators drawn over the price go to the price chart area, the others to a new area.
Deleting indicators
To delete an indicator, select it in the list and click the button to the right of its name.
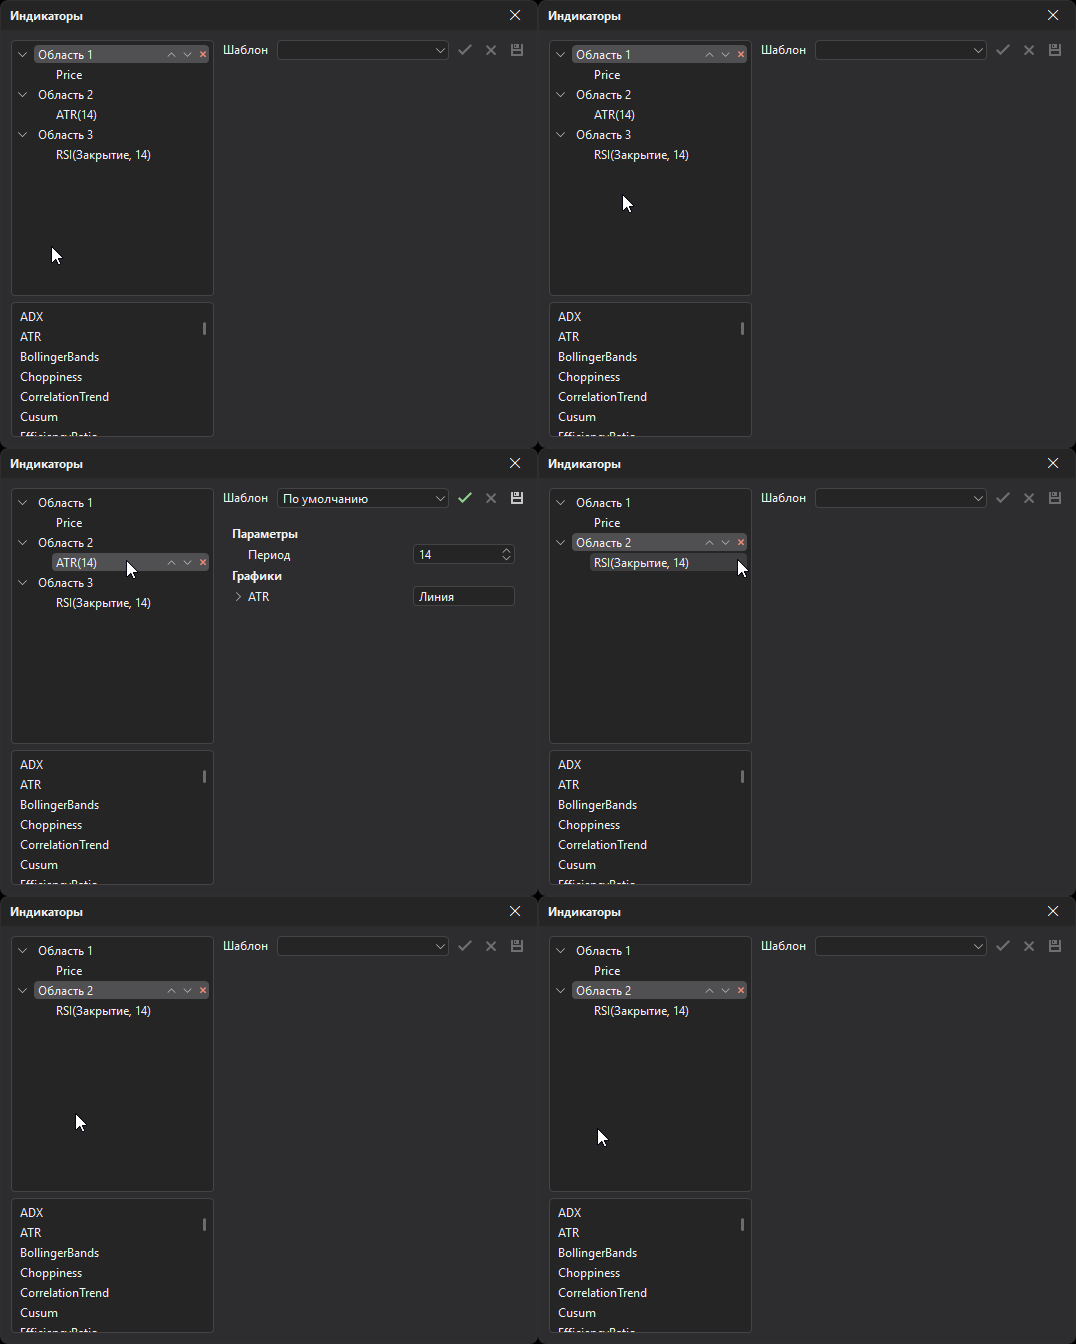
To delete all indicators of one area, click the button to the right of the area name.
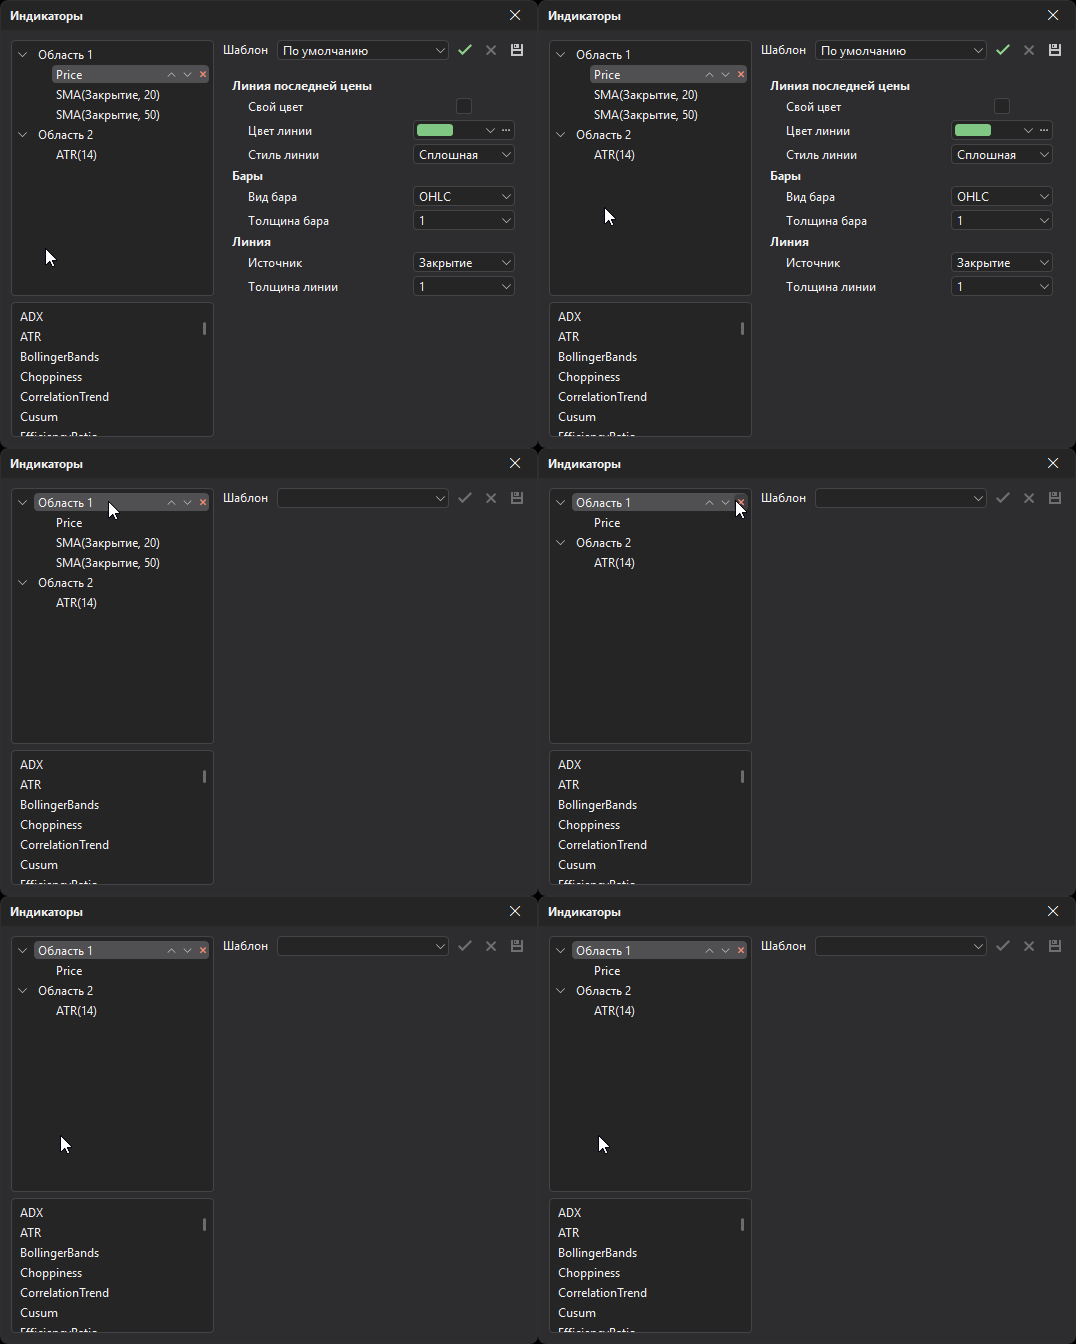
The Price indicator cannot be deleted — it draws the price chart, which is why in the example above it stayed in the area after the other indicators were deleted.
Settings templates
A settings template saves an indicator’s parameters and style so you can apply them to other indicators of the same kind. The templates area is in the upper right corner of the window.
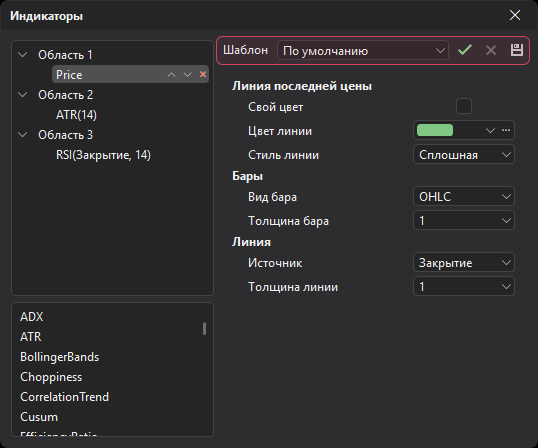
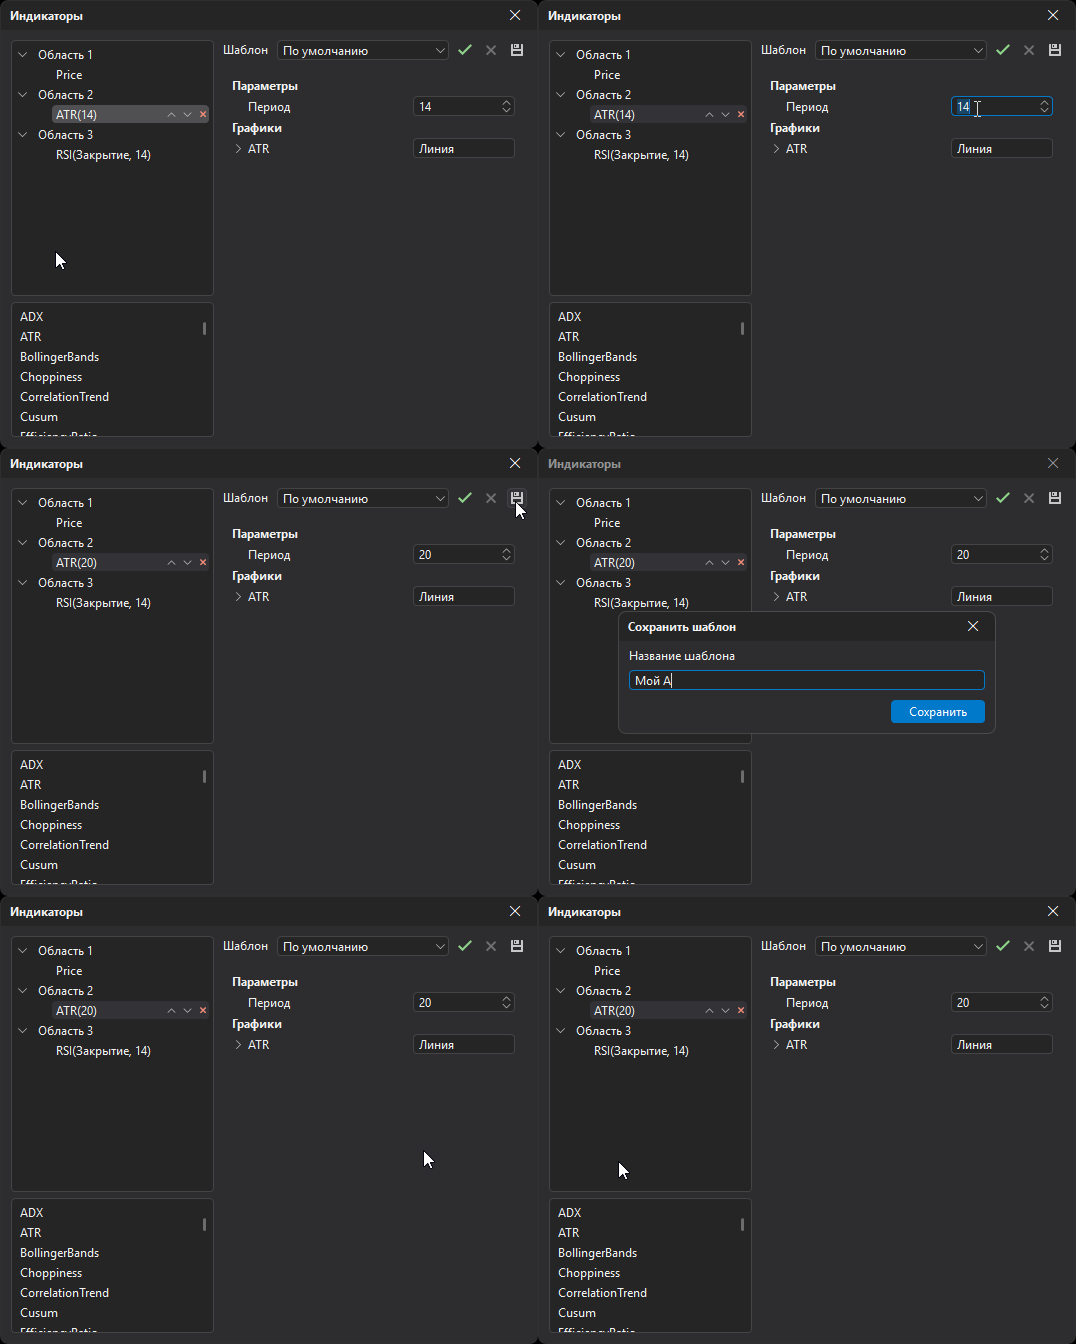
To save the current settings of the selected indicator as a template, click the button, enter a template name and click Save.
The Template field opens the list of templates for indicators of this kind. To apply a template, select it in the list and click the button.
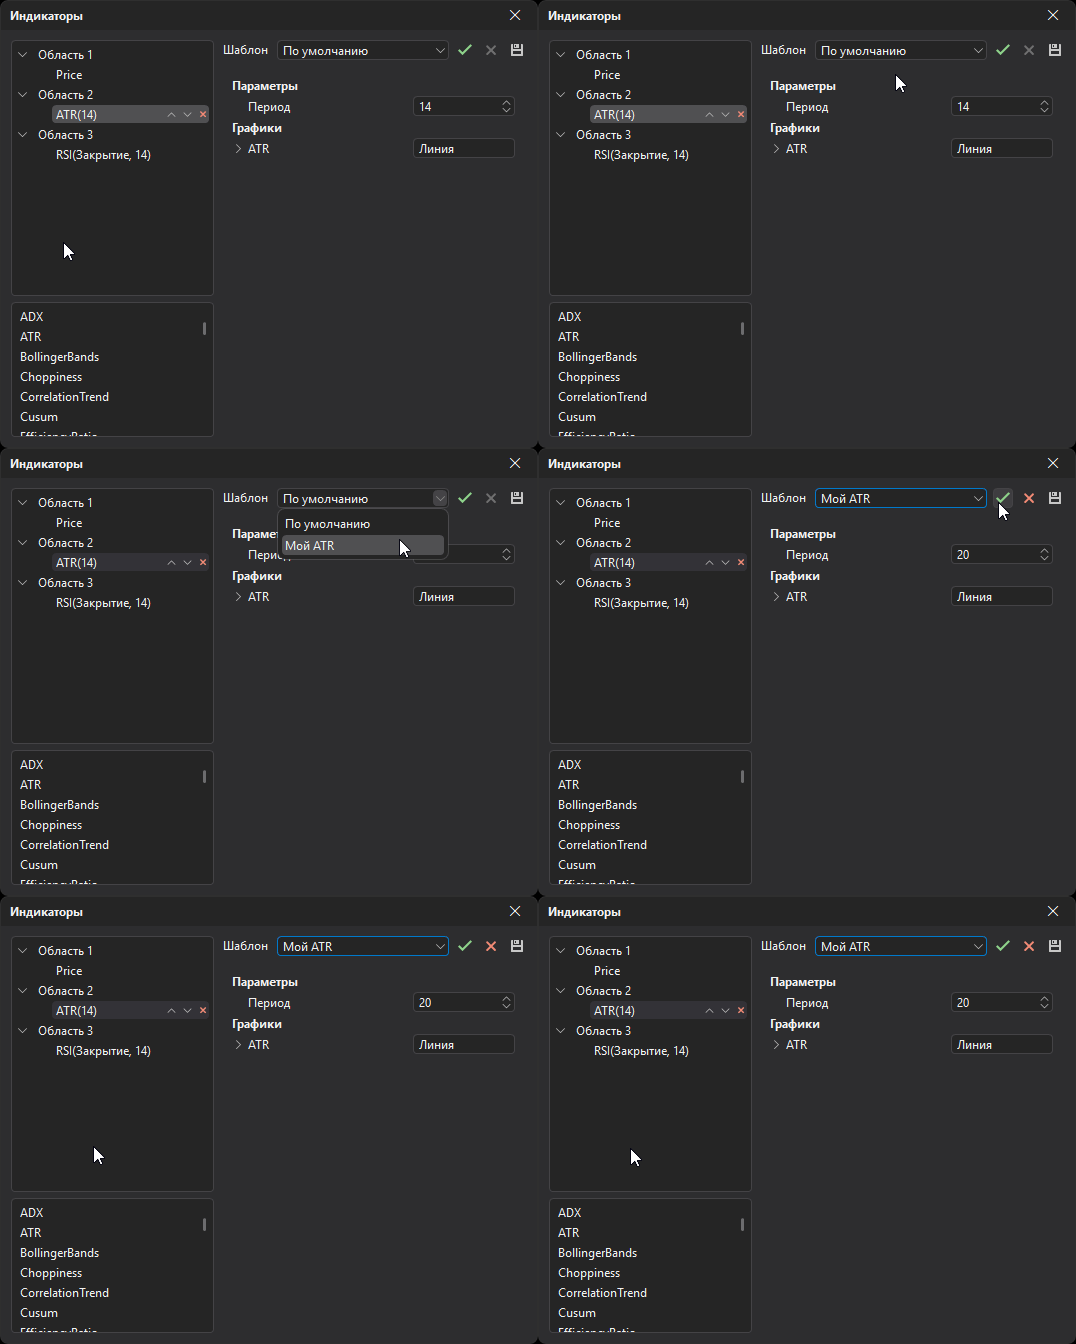
To delete the selected template, click the button.
To restore the indicator’s default settings, apply the Default template.