Chart theme
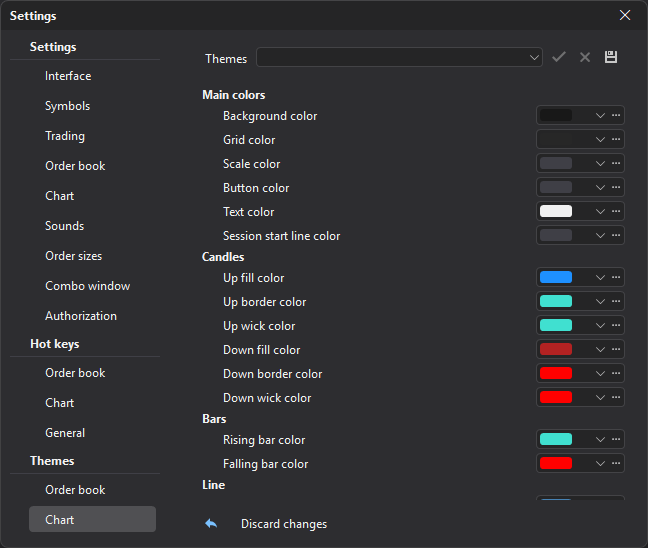
The Themes → Chart section sets the chart colors: background and scale, candles, bars and line, drawings and their control points, alert levels, cursor, chart trading, your trades and volume analysis.
| Group | Description |
|---|---|
| Main colors | Background, grid, scale, buttons, text, session start line. |
| Candles | Fill, border and wick of rising and falling candles. |
| Bars | Rising and falling bar colors. |
| Line | The chart line color. |
| Drawings | Line and background colors of drawings. |
| Control points | Background color of drawing control points. |
| Levels | The color of an alert level (Alert level) and of an inactive level (Inactive level). |
| Cursor | Color, width and style of the cursor line, marker background and text. |
| Trading | The colors of chart trading: Average price line color, Stop loss line color, Take profit line color, Liquidation line color, Second leg color (hedge mode), Buy order color, Sell order color, Preview color, Label background color, Label text color, Profit color in label, Loss color in label. |
| My trades | Background and border of your buy and sell trades. |
| Volume analysis | The colors of the past day levels, the developing day POC, the POC of the Volume profile object (also used for that object’s value area and volume nodes and gaps), the cluster search marks by volume, buys and sells, and the circles of large buys and sells and the sweeps. |
Last updated on