Main panel
The main panel is the row of buttons at the top of the chart window. From it you select the symbol and timeframe, change the chart view, add drawing objects and indicators, open the settings and templates, and turn on trading from the chart.

At the end of the panel, in a separate group, there are the Mouse trading and Trading panel buttons — they are not shown in the screenshot above.
To hide or show the main panel again, right-click the chart area and select Toolbars → Main toolbar.
While Settings → Hide window toolbars is on in the terminal’s main menu, this item only remembers your choice: the panel appears once window toolbars are shown again.
Chart settings
Click the Chart settings icon to open the settings of this chart: the grid, the last price and session start lines, showing your trades and position. All options are described on the Settings page.
Symbols
Click the Symbols icon to select the chart’s symbol. The same Symbols window opens as in the order book: search by name, tabs by symbol type and filters by exchange, class and currency. The window is described in Symbols of the order book main panel, the search and the order of the results in Symbol search.
Timeframe
Click the Timeframe icon to select the chart timeframe — the duration of one bar. Differences from the order book:
- the same menu is available in the chart context menu (right-click the chart area);
- the selected timeframe is shown in the chart window title, for example
1M— 1 minute. Notation:S— seconds,M— minutes,H— hours,D— days.
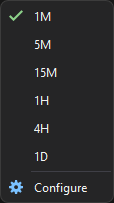
The list of timeframes is shared by the chart and the order book clusters. The Configure item opens the Timeframes window, where you add and delete timeframes, including second ones — see Timeframe of the order book main panel.
You can switch to the next or previous timeframe with hotkeys — see Chart hotkeys.
Chart type
Click the Chart type icon and choose how to draw the price: candles, bars, a line or footprint. The button icon changes to the icon of the selected view.
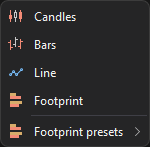
Candles
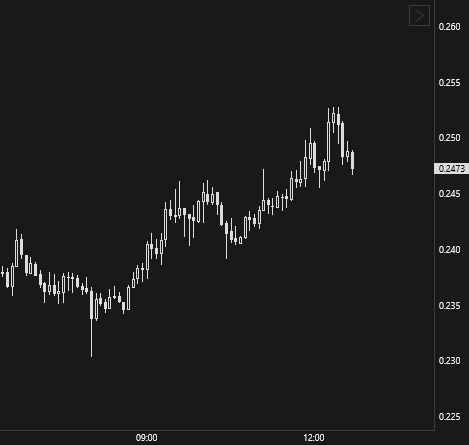
With Candles, each bar is a candle: a body between the open and close prices and wicks to the high and low.
Bars
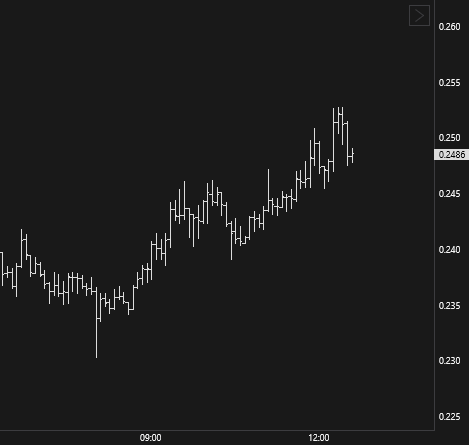
With Bars, each bar is a vertical line from the low to the high with ticks marking the open and close prices.
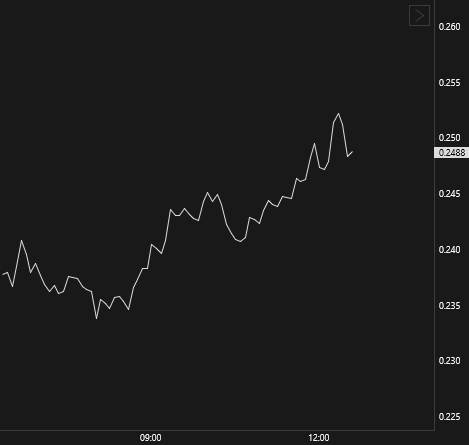
Line
With Line, a line connects the closing prices of the bars.
Footprint
Each bar is split into price rows with buy and sell volumes. The Footprint presets submenu holds ready sets of settings for this view, your own presets and the Footprint builder… item, which opens the footprint builder. See Footprint.
The bar type, the line width, the price the line is built from and the price line are set up in the indicator manager — in the Price indicator.
Drawing
Click the Drawing icon to pick a drawing object — a line, channel, rectangle, Fibonacci retracement, volume profile or text.
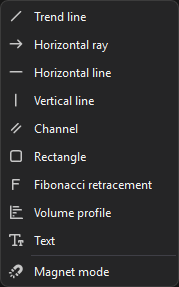
Select an object in the menu and build it on the chart with the mouse. The Magnet mode item turns snapping of the object’s points to the bar prices on and off. How to build objects and what they show is described on the Drawing objects page.
Indicators
Click the Indicators icon to add an indicator to the chart.
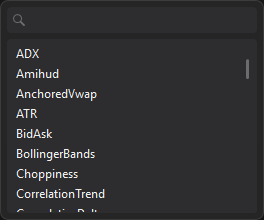
Start typing an indicator name in the search field at the top of the list to filter it, and click the indicator you need. The indicators are described on the Indicators page.
Reset zoom
Click the Reset zoom icon to return the chart to its initial view: it scrolls to the last bar, the bar width becomes standard, and automatic vertical scaling turns on in all chart areas.
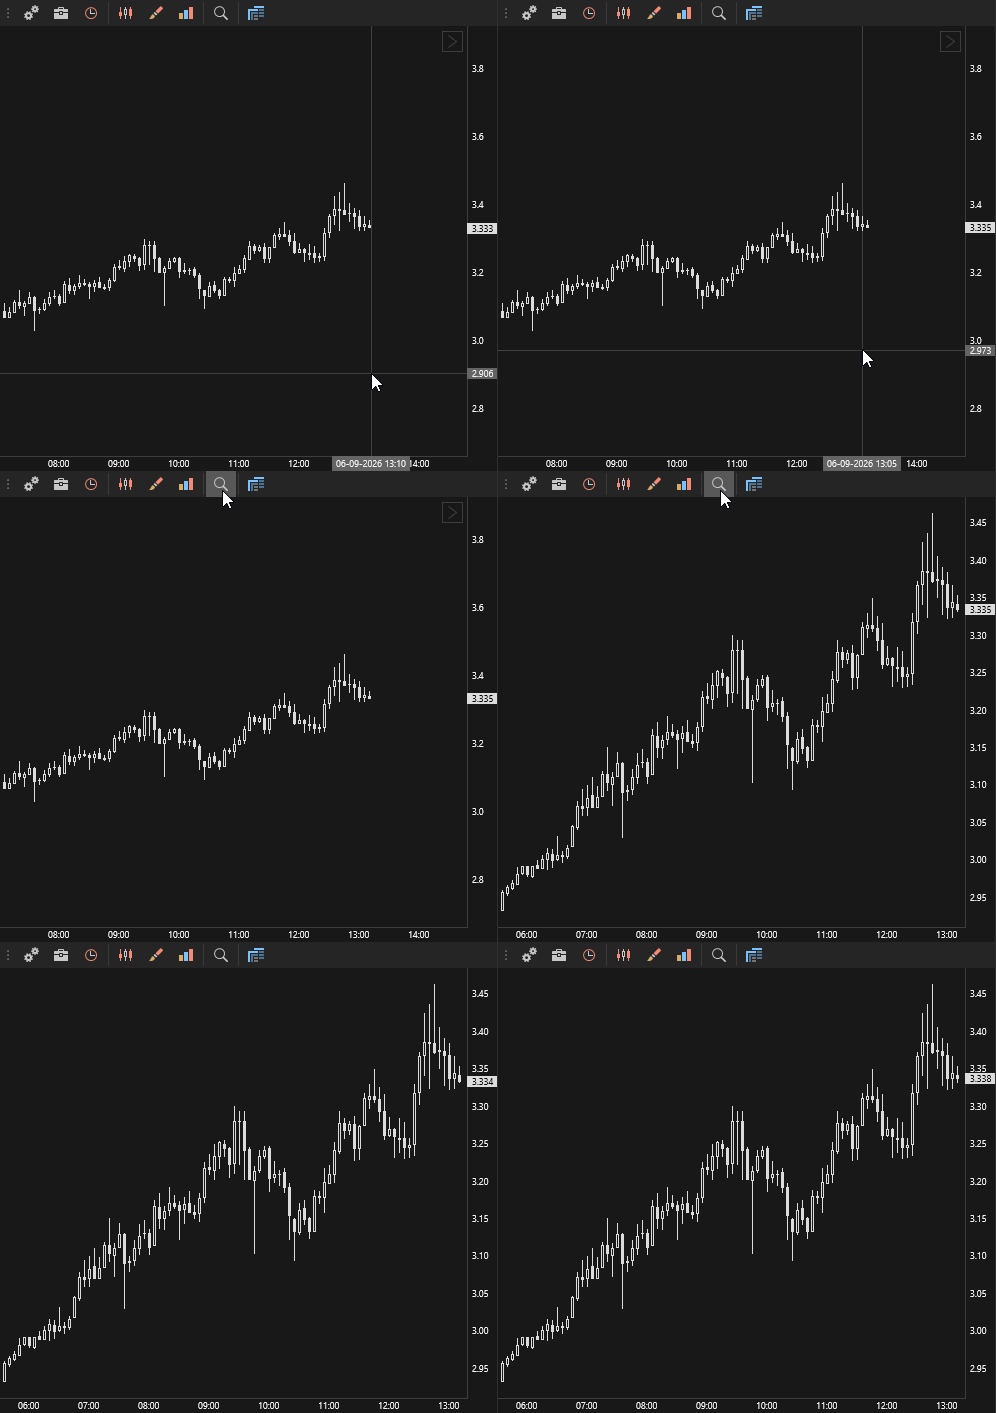
Other ways to change the zoom are described on the Zooming and moving page.
Templates
Click the Templates icon to save the chart’s settings, timeframe and indicators or to apply a saved template. Chart templates are stored separately from the order book templates and are described on the Templates page.
Mouse trading and Trading panel
Two toggle buttons at the end of the main panel turn on trading from the chart. On a new chart both are off.
- Mouse trading — Buy, Sell and Stop buttons appear at the cursor over the chart: clicking a button places an order at the price under the cursor. See Mouse trading.
- Trading panel — shows a floating order panel on the chart. See Trading panel.
On an account in hedge mode a position leg button appears next to them — see Hedge mode.
Moving the panel
You can move the main panel to another edge of the chart window — left, right, top or bottom. The Drawing panel moves the same way.
The panel is dragged only by the three-dot handle at its start: hover over it (the cursor turns into a crosshair with arrows), hold down the left mouse button and drag the panel to the edge you need.
The panel can only be docked to the edges of the chart window.
If the chart window is narrow, some of the main panel buttons are hidden. They are available through the arrow at the end of the panel.