Absorption and exhaustion
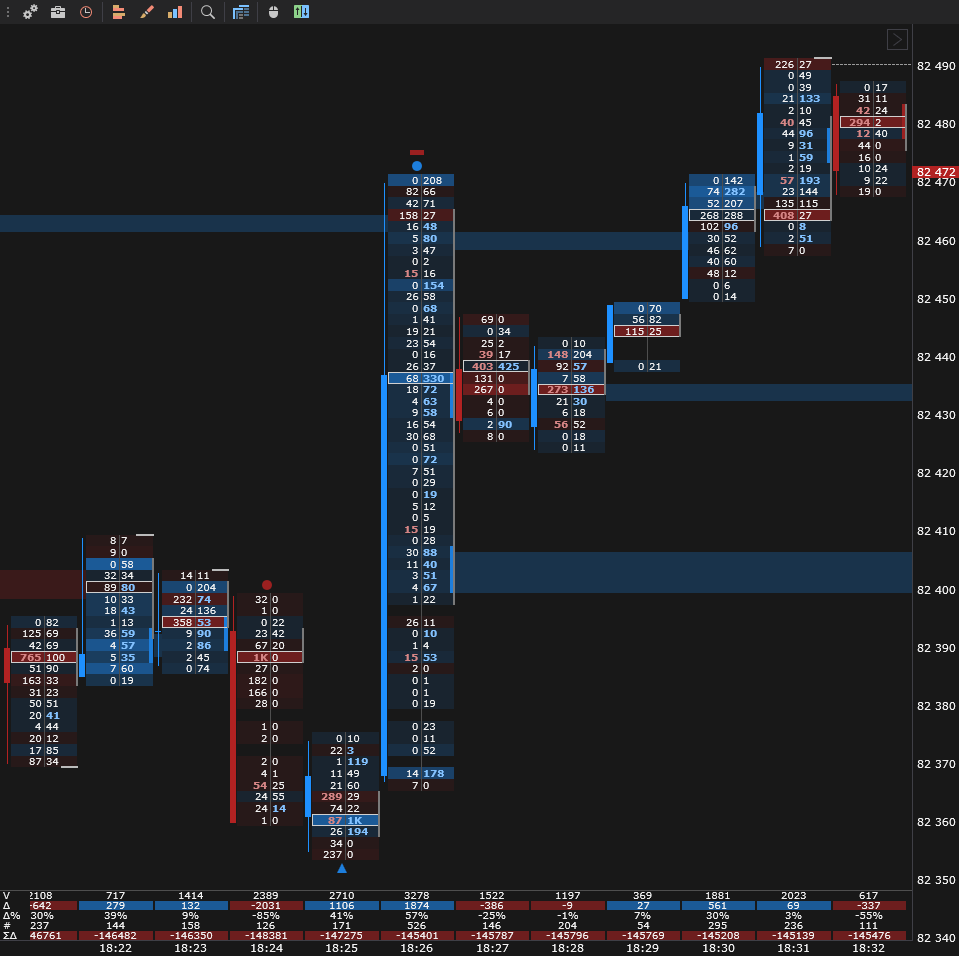
Absorption is a situation where a strong flow of aggressive orders from one side does not move price: it is “absorbed” by the other side’s passive orders. Exhaustion is the opposite: price has reached a new extreme, but the aggressors who pushed it there are getting fewer. This is a practice-level lesson: what of this can be seen in the data, how the terminal marks both pictures and how to read them in context.
Observation and interpretation
Both concepts come from the practice of reading the tape and the footprint, and they are usually explained through intentions: “a large seller is sitting at the level and taking all the buys”, “buyers have run out of steam”. The data do not show that. What the trades show is:
- absorption: a large volume of aggressive buys at a price, and price did not go higher — the passive sellers at that price did not run out;
- exhaustion: price made a new high, but the volume of aggressive buys at the last prices toward the high was decreasing — new highs were set with ever smaller trades.
Why the sellers did not run out — one large participant, an iceberg order, liquidity providers or many small sellers at once — cannot be established from trades (see The auction: why price moves). The passive side is visible in the order book: whether the level was being executed and whether it was being replenished. That is why absorption is convenient to watch in the order book window, where the book, the tape and the clusters sit side by side (lesson Order book, tape and footprint).
Formal rules in the footprint
To find absorption and exhaustion without eyeballing them, the JetScalp terminal writes them down as rules. They are checked on closed footprint bars and only at a new extreme — when a bar has made a high or low beyond several previous bars (5 by default). Rows are taken at the cluster step from the settings; a bar with fewer than six rows gets no marks.
Buy absorption (at a new high): among the bar’s two top rows there is a row whose volume is 2.5 standard deviations above the bar’s mean row volume, the buys in it exceed the sells, and the bar closed below this row. It reads like this: near the high, buyers hit the offer many times, but price did not get through and went down.
Buy exhaustion (at a new high): the buys in the three top rows strictly decrease toward the high, and the volume of the very top row is no more than half the bar’s median row volume. It reads like this: price approached the high on ever smaller aggressive buys.
For lows the rules are mirrored. The thresholds, the marks on the chart and the alert are described in Bar signals of the footprint page.
The new-extreme condition keeps the marks rare: on one-minute bars they appear infrequently, and each one stands out. Without this condition, “absorption at the edge” would be flagged far more often, and such a mark would stop catching the eye.
These rules are a formalization of the practice of reading the footprint. There is no generally accepted strict definition of absorption and exhaustion; the wording was chosen so that the event is rare and describes exactly the picture traders call by these names. A mark is a reason to take a closer look at the bar; the decision is made together with the level, the market regime and your risk.
Absorption strength from λ
There is another approach: instead of looking for a pattern inside the bar, compare how far the bar moved with how far it “should have” moved given its delta. If buying flow was strong but price moved noticeably less than usual, that is absorption; if it moved much more, that is a “vacuum”: there were almost no opposing orders (see Liquidity and market impact). In the terminal this is the KyleLambda indicator.
More: how absorption strength is calculated
It uses Kyle’s lambda — the average sensitivity of a bar’s price change to its delta in the recent past. For a bar with a large delta :
Here is the bar’s price change in ticks, is the change expected from the delta, and is the typical spread of deviations from that expectation in past bars. Positive strength means price moved less than expected (absorption); negative strength means it moved more (a “vacuum”).
Limitations: λ is an estimate from past bars that itself changes; the bar close depends on the price of the last trade; a bar with “absorption” may have reversed for reasons unrelated to its delta.
Effect of the market regime
The same picture means different things in different regimes. In a wide range, absorption at its boundary is the normal work of liquidity providers, and price often goes back after it. In a strong trend, absorption at yet another high may turn out to be a pause before continuation: the passive sellers at the level run out, and price goes through it. So read such pictures with the regime in mind (lesson Market regimes).
Examples of false interpretations
- “Absorption means a large seller, so a reversal is inevitable.” The picture describes executed trades; who stood at the level and whether they will stay there is unknown.
- “Exhaustion at the high means a top.” Buys fading toward the high also occur in pauses within a trend.
- “It worked in three examples, so it will work now.” Each case is read anew: where the level is, what the regime is, where the idea is invalidated and what the risk of the trade is.
In the JetScalp terminal
Absorption and exhaustion marks are turned on with the Bar signals parameter, and Alert: bar signals reports such a bar to the Notifications window even when the chart is minimized — see Bar signals. The KyleLambda indicator is added to the chart in the indicator manager. How to set up the footprint itself — lesson The footprint chart.
Summary
- The data show executions and price movement, but not intentions; the passive side is shown by the order book.
- The terminal marks both pictures with rules at a bar’s new extreme; these are rare marks, not noise at every edge.
- Absorption strength from λ compares a bar’s move with the move expected from its delta.
- What a picture means depends on the market regime; read it together with the level and your risk.
Check yourself
- When people say “a seller is absorbing the buys”, what exactly is visible in the trades, and what is a guess?
- Why do the terminal’s rules require a new extreme?
- A bar with a large positive delta did not change price. What will be the sign of the absorption strength from λ, and why?