Order book, tape and footprint
The order book shows what is waiting to be executed, the tape shows what has been executed, and the footprint shows how the executed volume was distributed across prices and sides inside the bar. None of these views gives the full picture, but together they let you separate what actually happened from what only seems to have happened. This is a practice-level lesson: a step-by-step case study of one typical situation and a list of questions worth asking yourself before a trade.
A teaching scenario
The situation below is a teaching one, and its numbers are made up: the case study shows the order of reasoning, not a specific day. The price of a futures contract approaches the 90,500 level from below for the third time in ten minutes. A noticeable sell volume is resting at 90,500 in the order book. What can be learned, and what cannot?
Step 1. Order book: what is waiting
The order book shows how much is resting at 90,500 and at the levels above, and whether that volume changes. It is important to tell two pictures apart:
- the volume at the level decreases, and at the same time the tape shows trades at 90,500 — the level is being executed;
- the volume disappears abruptly without trades — the orders were canceled (see The order book).
What the order book will not tell you: whether one order or many stand behind the level, whether there is hidden volume, and whether it will stay in place when price comes up.
Step 2. Tape: what is executed
The tape shows how many aggressive buys go through at 90,500, in what bursts and how fast. If much more was executed than was visible in the order book and the level did not disappear, it was being replenished — by an iceberg, by new sellers or by a liquidity provider; the data cannot tell these apart (see The auction: why price moves).
Step 3. Footprint: how it landed in the bar
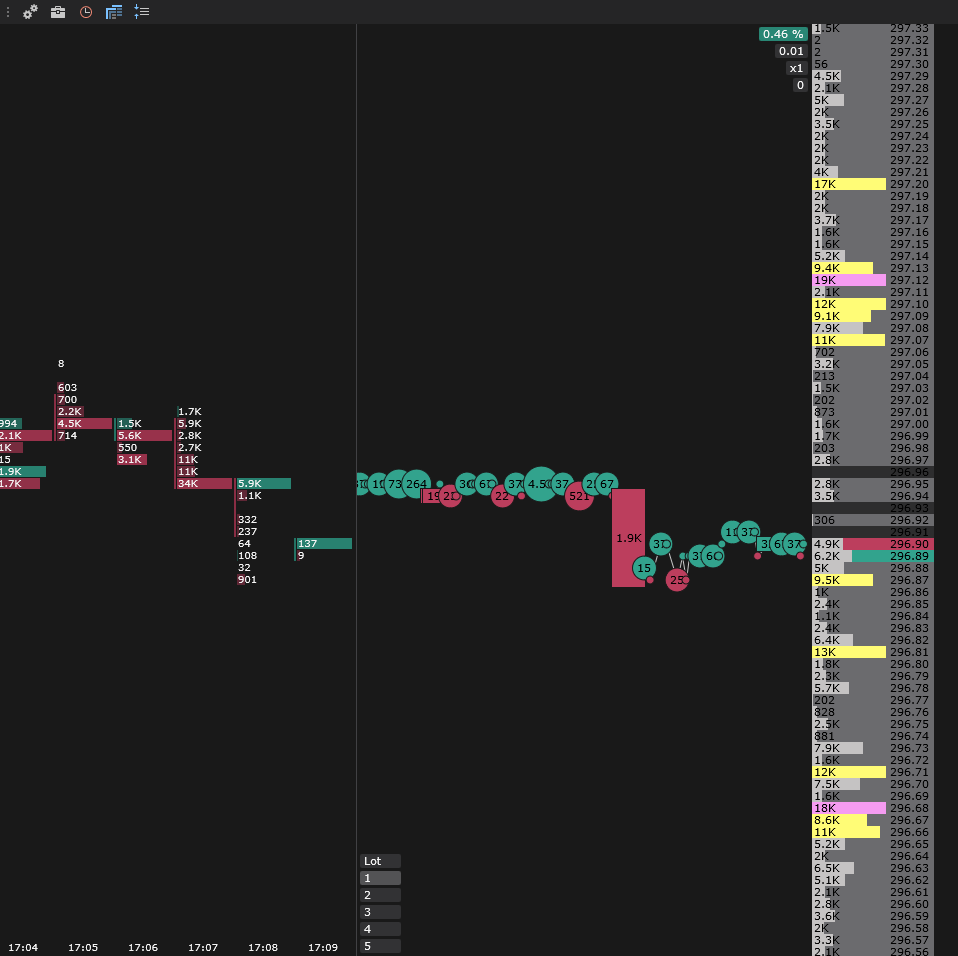
The footprint of the bar that approached the level shows how many buys and sells traded at 90,500 and the neighboring prices, and where the bar closed. Typical pictures:
- large buys at 90,500, the bar closed lower — an absorption picture: aggressive buys executed against sellers, and price did not get through (lesson Absorption and exhaustion);
- small buys at 90,500, the bar reversed — an exhaustion picture: price approached the level without pressure;
- stacked buy imbalances above 90,500 — the level was crossed aggressively, and above it buyers outweighed sellers many times over (lesson Imbalances).
Step 4. Delta and price: the outcome
The bar delta and the cumulative delta show which way the flow pulled over the bar and over the day. Strong positive delta while price stalls at 90,500 leads to the same conclusion as the footprint: there is flow but no movement. Strong delta and a break through the level mean that the flow went through the liquidity.
What is confirmed and what is interpretation
| Conclusion | Status |
|---|---|
| 1,200 lots of aggressive buys were executed at 90,500 | Fact: tape and footprint. |
| The visible volume at the level was 400 lots, and the level did not disappear | Fact: order book and tape. |
| The level was being replenished | A fact as a consequence of the previous two; by whom is unknown. |
| “A large seller is sitting at the level” | Interpretation: an iceberg, several sellers or a liquidity provider can all look like this. |
| “Price will reverse from the level” | Hypothesis: what price does next will confirm or refute it. |
What to check before a trade
- Is it execution or cancellation? Compare the changes in the order book with the tape.
- How much was executed versus how much was visible? Replenishment of a level and a break through it are different pictures.
- Where did the bar close relative to the level? A bar that has not closed yet can still change the picture.
- What is the market regime? Absorption at a range boundary and at a high in a trend mean different things (lesson Market regimes).
- Where is the idea invalidated? If the level breaks, where do you exit, and what does that cost at the current spread and depth (lesson Risk and position size)?
- Does the picture fit your plan? A picture without a level, a regime and an exit point known in advance is an observation, not a rule.
Important: The case study describes how to read the data, not a signal to trade. Any entry requires a stop-loss and a position size calculated from risk.
In the JetScalp terminal
Order book, footprint and tape in one window — Order book area, Clusters area, Tape area; the footprint on the chart — Footprint.
Summary
- The order book is expectations, the tape is executions, the footprint is how executions are distributed across prices and sides; you need all three.
- The key questions: execution or cancellation, executed versus visible, and where the bar closed.
- Keep facts, consequences of facts and interpretations separate.
- Decisions are made on several signs together — with the level, the market regime and your risk.
Check yourself
- How can you use the order book and the tape to tell the execution of a level from canceled orders?
- Why is “a large seller is sitting at the level” an interpretation, while “the level was being replenished” is a fact?
- Which three questions from the list would you ask first, and why?