Delta and CVD
Delta is the difference between the volume of aggressive buying and aggressive selling. It shows which side initiated the trades, but not where price will go. This is a practice-level lesson: delta formulas, cumulative delta (CVD), divergences and why positive delta with a falling price is common.
Formulas
For a bar (or a footprint row):
Here is the volume of trades where the buyer was the aggressor (trades at the ask), and is the volume where the seller was (at the bid). Delta % ranges from −100% (all trades are aggressive sells) to +100%; it is convenient for comparing bars with different volumes.
Cumulative delta (cumulative volume delta, CVD) is the sum of bar deltas since the start of the period:
In the terminal it resets at the start of each day by default; the period can be set to a week, a month or the whole history.
What delta shows
Delta answers the question “who was impatient more often”. A positive bar delta means that more aggressive buys were executed than aggressive sells. This is a fact about order flow. But, as discussed in the lesson The auction: why price moves, price also depends on the passive side, so a minute with positive delta often closes below the previous one.
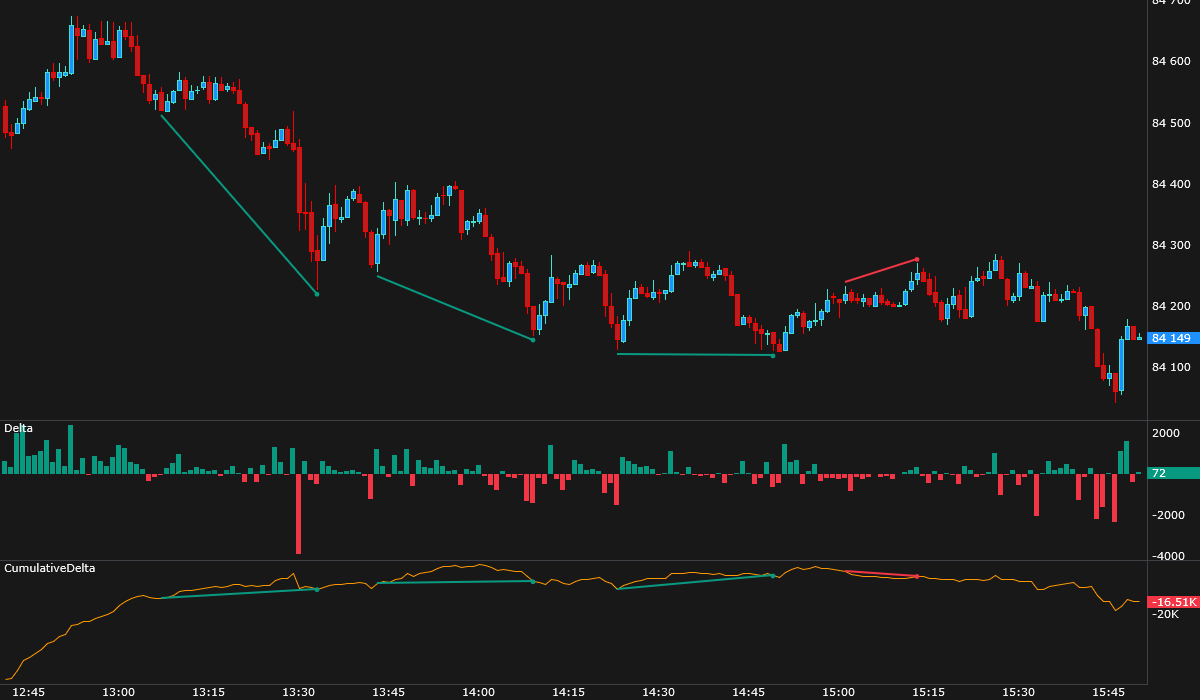
Positive delta with a falling price means that buyers were executing against sellers, yet price still went down: sellers’ orders kept moving lower and no buyers came in to take their place, or price fell at moments of small delta while the delta was “gathered” on pullbacks. Negative delta with a rising price is the mirror case.
Cumulative delta and divergences
CVD shows which way the flow of aggressive orders “pulled” over the period. In the picture, the day’s cumulative delta first rises quickly and then flattens, even though price falls over almost the whole stretch. Such a mismatch is called a divergence:
- bearish — price makes a new high, but CVD does not (aggressive buying did not support the new high);
- bullish — price makes a new low, but CVD does not;
- hidden divergences are the mirror image: CVD makes a new extreme, but price does not.
In the terminal, divergences are searched for between local extremes (pivot points) of price and CVD: a pivot is confirmed once a set number of bars has passed to its right, so a divergence appears on the chart with a delay of those bars. There is also a simplified bar version in the footprint: the bar made a high above the previous bars, and its delta is negative.
A divergence is a reason to take a closer look, not a ready-made reversal signal: in the picture, the bullish divergences at 13:30–14:50 did not stop the decline for long. It is most useful at a notable level, when price approaches it while the flow of aggressive orders no longer supports the move; read it together with the level, the market regime and your risk.
Classification errors
Delta relies on the side of each trade. Its quality depends on the data:
- On the Moscow Exchange and on crypto exchanges the aggressor side is reported by the exchange itself in the trade feed. This is more accurate than reconstructing it with rules like “a trade at the ask is a buy”, which are used where the side is not available.
- If some trades carry no side flag, they have to be assigned to one side by a rule — a small but systematic shift in delta.
- Cumulative delta adds up the errors: a small systematic bias over a day turns into a noticeable slope of CVD.
Using delta sensibly
- Compare delta with what price did: strong delta and a move in its direction — the flow went through the liquidity; strong delta without a move — the flow was absorbed (lesson Absorption and exhaustion).
- Look at delta by price inside the bar (the footprint), not only at the bar total: the same bar delta can build up near the high or near the low.
- Do not draw conclusions from the absolute level of CVD: what matters is its changes and its divergences from price, while the level depends on where the count starts.
In the JetScalp terminal
Delta — delta by bar; CumulativeDelta — cumulative delta, its divergences and alerts; the Delta and Delta, % modes of the footprint.
Summary
- Delta is aggressive buys minus aggressive sells; Delta % is delta as a percent of volume.
- CVD is the sum of deltas since the start of the period; in the terminal, by default, since the start of the day.
- Positive delta while price falls is a normal picture if the passive sellers did not run out.
- Divergences are a reason to take a closer look at a level; the terminal confirms them with a delay of the bars to the right.
- Delta inherits the errors in classifying the side of trades, and CVD accumulates them.
Check yourself
- A bar: buys 3,000, sells 1,000. What are the delta and Delta %?
- Why can CVD rise all day while price falls?
- Why does a CVD divergence not appear on the chart right at the pivot point?