VWAP
VWAP (volume weighted average price) is the average price at which volume has traded since the start of the day: each trade enters the average with the weight of its quantity. It is the most “participant-driven” line on the chart: it shows the average price at which everyone who traded today bought and sold. This is a practice-level lesson: how VWAP is calculated, how VWAP from bars differs from VWAP from trades, what its bands and derived indicators show, and how to use them in trading.
Definition
VWAP is the sum of “price × quantity” over all trades since the start of the period, divided by their total quantity. If you bought below VWAP today, you bought cheaper than the market bought on average; that is why VWAP is used as a benchmark for the execution quality of large orders. Calling VWAP the “fair price” is a convention: it is the average of the volume that has traded, not an estimate of the asset’s value.
More: the formula
where and are the price and quantity of the -th trade since the start of the period.
From trades and from bars
The chart does not show the trades of an individual bar, so the indicator calculates VWAP from bars: instead of each trade’s price it takes a single bar price — by default the typical price — weighted by the bar’s volume. In practice:
- On one-minute bars with the typical price, VWAP from bars almost matches the exact VWAP from trades: the difference is usually on the order of a tick.
- Using the close instead of the typical price noticeably increases the difference: the close is a single last trade, not the middle of the bar. Keep Source set to Typical.
- The larger the bars, the larger the difference: on 15-minute bars it can already be noticeable. If you need VWAP as an exact level for a limit order, look at it on the one-minute timeframe.
VWAP on MOEX: the morning session
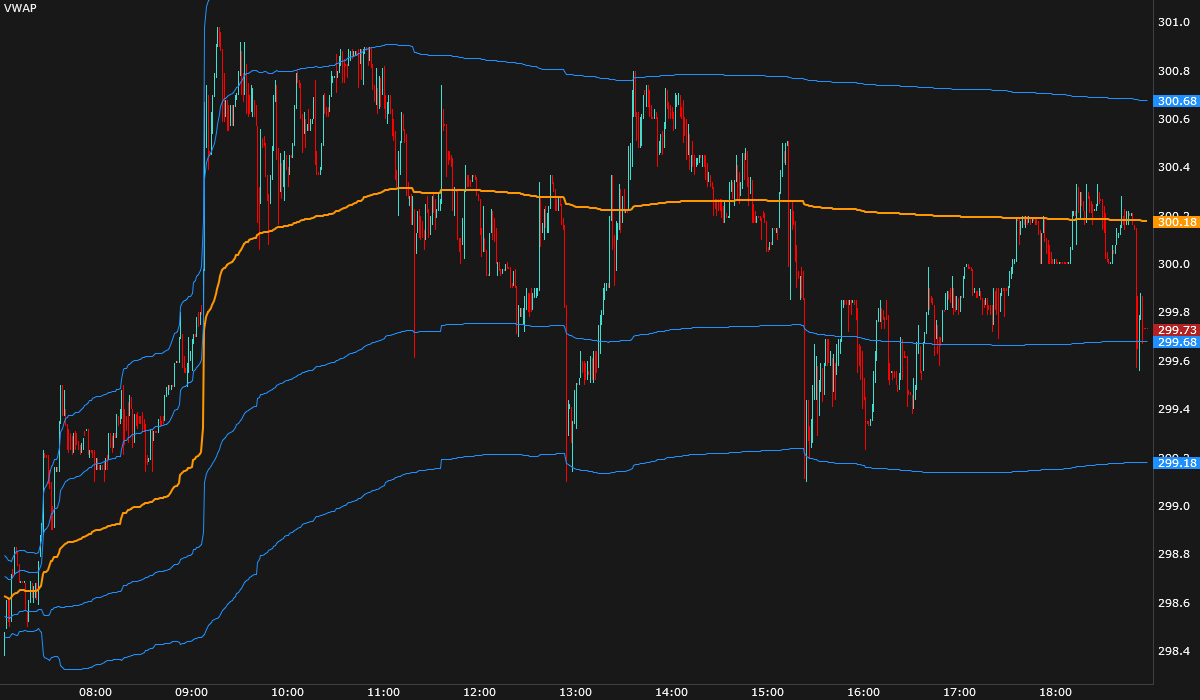
VWAP with Anchor period set to Day accumulates from the start of the calendar day, so on the Moscow Exchange it includes the morning session. For shares the morning carries a noticeable share of the daily volume (on the order of 5–10%), for currency futures very little. Keep this in mind in the first hours of the main session: if the morning traded at a different price, VWAP will lag behind the price until the main-session volume “catches it up”.
Bands
VWAP bands are VWAP ± several volume-weighted standard deviations of bar prices from VWAP. Early in the day σ is small and the bands are narrow; by midday they stabilize. The bands describe the dispersion of the day’s prices: going beyond 2σ says that the price has moved further from the participants’ average than is usual for this day, not that it “must come back”.
Derived indicators
- VwapDeviation — the deviation of the close from VWAP in σ and the VWAP slope in the same units. A slope near zero means a day on which the price moves around VWAP; a slope far from zero means a trend day.
- MeanReversion — a model of reversion to VWAP over recent bars. It gives the half-life — in how many bars the deviation halves on average — and the s-score. If the half-life is longer than your trade, do not count on reversion within the trade; if the model finds no reversion on this window, the indicator shows that.
- AnchoredVwap — VWAP not from the start of the day but from an event: a volume spike, a channel breakout or a swing. A swing anchor becomes known only a few bars after the top — the same confirmation delay as for fractals (see the What indicators measure lesson).
How to use VWAP
- Execution benchmark. Buying below VWAP is cheaper than the market’s average for the day; selling above it is dearer.
- Market side. A price above VWAP means that those who bought today are, on average, in profit; below it, at a loss.
- Day type. The VWAP slope (VwapDeviation) separates a day around the average from a trend day. On a trend day the price can stay beyond the 1σ band for a long time, and a “reversion to VWAP” trade goes against the move.
- A level to watch. A touch of VWAP or a band is a reason to look at volume, delta and the tape at that price. Read it together with the day’s regime and the risk; place the stop beyond the level, allowing for the usual bar range.
In the JetScalp terminal
VWAP, AnchoredVwap, VwapDeviation, MeanReversion.
Summary
- VWAP is the average price of the volume traded since the start of the period; an execution benchmark, not an estimate of value.
- VWAP from one-minute bars with the typical price almost matches VWAP from trades; on large bars and with the close price the difference is larger.
- On MOEX the day’s VWAP includes the morning session — in the first hours of the main session it can lag behind the price.
- The bands describe the dispersion of the day’s prices, the slope the day type; a touch of VWAP is read together with volume, regime and risk.
Check yourself
- Why can VWAP from 15-minute bars with the close price differ noticeably from VWAP from trades?
- The morning session traded 1% below the main session. How will this affect the day’s VWAP at 10:00?
- The MeanReversion half-life is 60 bars, and your trade lasts 10 minutes on one-minute bars. What does this mean?