Volume profile
A volume profile is volume summed by price over a chosen period: at which prices the market traded a lot and which prices it passed quickly. If a footprint is the profile of a single bar, a volume profile is the profile of a day, several days or a selected range of the chart. This is a practice-level lesson: POC, the value area and its calculation, high- and low-volume nodes, the types of profiles and what follows from them.
How a profile is built
Take all the trades for the period and add up their volume by price (or by rows of several ticks). The result is a histogram turned on its side: long bars are prices where a lot traded, short ones are prices where little traded.
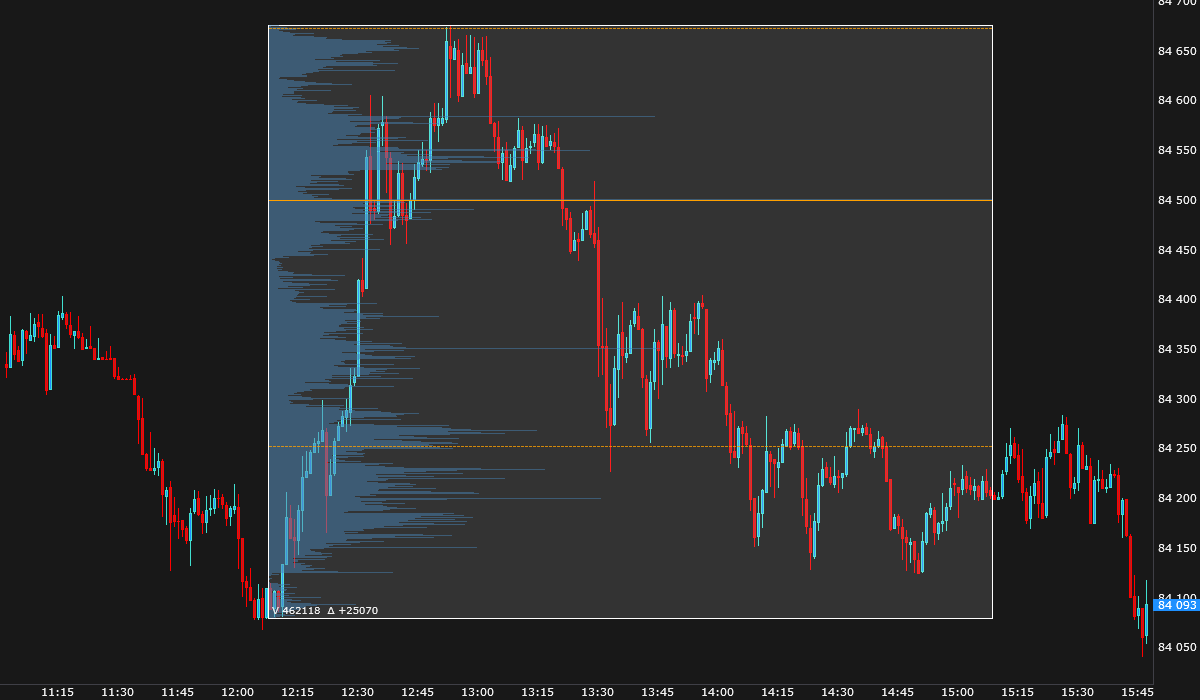
POC and value area
POC (point of control) is the price with the largest volume over the period. If there are several such prices, the terminal takes the lowest one.
The value area is the price range around the POC in which a set share of the volume traded, usually 70%. Its upper bound is VAH (value area high), its lower bound is VAL (value area low). It is calculated like this:
- Start with the POC row.
- At each step, compare the volume of the neighboring row above and of the one below the area collected so far, and add the one with the larger volume; if they are equal, add both.
- Stop when the area holds at least 70% of the period’s volume.
Example. Rows (bottom to top) with volumes 10, 30, 80, 120, 60, 20; the total is 320, and 70% of it is 224. Start with the POC (120). The neighbors are 80 below and 60 above: take 80, the area holds 200. The neighbors are 30 below and 60 above: take 60, the area holds 260 ≥ 224 — stop. The value area is three rows: 80, 120, 60.
The value area is not a “fair price” but a description of where the bulk of the trading took place during the period. In volume profile practice, price inside the area is considered “accepted” by the market, and a move beyond its bounds is seen as a search for a new price. That is why VAH, VAL and POC are often used as levels where traders watch the price reaction and the trade flow.
High- and low-volume nodes
A profile rarely has a single peak. High-volume nodes (HVN) are local maxima of the profile: prices around which trading went on for a long time. Low-volume nodes (LVN) are local minima: prices the market passed quickly. In the picture there are high-volume nodes at the POC (84,500) and around 84,200, and between them, roughly from 84,300 to 84,450, the volume is noticeably lower — a low-volume node.
The usual interpretation: in a high-volume node price “gets stuck” — many participants hold positions there — while a low-volume node is crossed quickly. On a profile with a one-point step, nodes look “ragged”, so they are searched for on a smoothed profile; in the terminal, high- and low-volume nodes on profiles are found automatically by how prominent a peak is relative to the neighboring saddles.
Types of profiles
| Profile | What is summed | Purpose |
|---|---|---|
| Day | All trades of the current day | Where most trading took place today; where price is relative to the day’s value area. |
| Visible range | Trades of the bars visible on screen | The structure of the part of the chart you are looking at. |
| Selected range | Trades between two chosen moments | The profile of a specific move or range, as in the picture. |
| Several days | Past days together with the current day | Nodes and areas that formed over the week. |
The developing POC is where the day’s POC stood at the close of each bar. Its shifts show how the price at which the day’s volume is concentrated moved. Past day levels are the POC, VAH and VAL of previous days, drawn as lines on the chart; in practice they are treated as possible price reaction levels.
Limitations
- A profile depends on the period. A profile from 10:00 and a profile from 7:00 are different, with different POCs and areas. “The POC level” without a period is an incomplete statement.
- A profile depends on the row step. With coarse rows nodes merge, with fine rows they break up.
- Volume at a price is not the strength of a level. A node is a place where a lot traded in the past, not a promise that trading will happen there again.
- A profile from candles is an estimate. If a profile is built from candles without trades, each bar’s volume is spread evenly across the prices from its low to its high — an approximation. In the terminal, the Volume profile object uses footprint data, and where there is none, it states explicitly how many bars were estimated.
In the JetScalp terminal
The profile on the right, the developing POC and past day levels — see Footprint; the profile of a selected range is the Volume profile object.
Summary
- A volume profile is volume by price over a period; the POC is the price with the largest volume.
- The value area grows from the POC toward the larger neighbor until it holds 70% of the volume; VAH and VAL are its bounds.
- High-volume nodes are places of prolonged trading, low-volume nodes are prices passed quickly; they are searched for on a smoothed profile.
- A profile depends on the period and the row step; its levels are places to watch the price reaction, not a promise of a bounce.
Exercise
Build the 70% value area for rows with volumes (bottom to top) 5, 40, 40, 100, 30, 50, 35. Pay attention to the steps where the neighbors above and below are compared, and to the fact that the row of 50 never gets into the area: the small row of 30 stands in front of it, and only the nearest neighbors are compared.
Check yourself
- Why does the value area have no single correct value unless the period is specified?
- How does a high-volume node differ from the POC?
- Why is a profile built from candles without trades only an approximation?