Moving averages
A moving average is an estimate of the price “level” with part of the small fluctuations removed. It is used to see the direction of a move (the slope of the average), how far the price has moved away from it, and where the move reversed. This is a practice-level lesson: how the terminal’s averages work, how much smoothness costs in bars of lag, and what their crossover really means.
Simple, exponential, weighted
The simple moving average (SMA) is the mean of the closes of the last bars, all with equal weight. The exponential moving average (EMA) moves toward the price on every bar by a fraction of the distance to it; the weight of old bars decreases but never becomes zero. The weighted moving average (WMA) gives the last bar a weight of , the previous one , and so on down to 1.
More: the SMA and EMA formulas
Lag in a steady trend (the price rises by the same amount on every bar):
| Average | Lag, bars | At |
|---|---|---|
| SMA | 9.5 | |
| EMA | 9.5 | |
| WMA | 6.3 |
The common claim “an EMA is faster than an SMA” is only half true: an EMA reacts more strongly to a price jump (the weight of the last bar is versus — almost twice as large), but in an established trend an EMA and an SMA of the same period lag equally.
Adaptive averages and filters
The other average types in the terminal try to reduce lag without letting all the noise through:
- KAMA (Kaufman’s adaptive moving average) changes its speed with the efficiency ratio — the ratio of the price displacement to the path traveled (see EfficiencyRatio in the Market regimes lesson). In a choppy market the path is long and the displacement small, so the average almost stands still; in a clean move the weight of the new bar reaches (2/3)² ≈ 0.44 — as in EMA(3.5), and in a steady trend without noise it lags by about 1.25 bars. The more noise, the slower KAMA.
- SuperSmoother is Ehlers’ two-pole filter: swings shorter than the cutoff period are smoothed strongly, longer ones pass almost unchanged. With a period of 20 it lags by about 4 bars in a steady trend — half as much as SMA(20).
- UltimateSmoother is the price minus a high-pass filter of the same type: in a steady trend it does not lag at all, but it lets more swings through and overshoots the price at reversals.
- Kalman is the level of a Kalman filter with a “level + velocity” model: in a steady trend it follows the price without delay, the share of a new bar is the same as for an EMA of the same period, and a jump on a single bar is capped.
For Ehlers’ filters the period is the cutoff period, not the window length: SuperSmoother(20) and SMA(20) smooth differently, and you cannot compare them “by period”.
Compare the types in the example below. With a period of 20 and noise of 2.5 on this series, SMA lags the signal by 9 bars with residual noise of 0.64; SuperSmoother lags by 4 bars with almost the same noise (0.68); UltimateSmoother does not lag but leaves twice as much noise (1.20); KAMA almost stands still in such noise and lags by 17 bars — which is exactly how it is designed: to move only on a clean move.
Thin line — the price, dashed — the signal without noise, colored — the average
The series is synthetic: the signal is known, so the lag and the noise can be measured. The lag is the shift at which the average is closest to the signal; the noise is the root mean square distance to the signal at that shift. "On a straight trend" is the lag on a clean straight line; for KAMA it holds only without noise: noise slows it down. The period of SuperSmoother and UltimateSmoother is the filter's cut-off period, not a window length.
Averages on a real chart
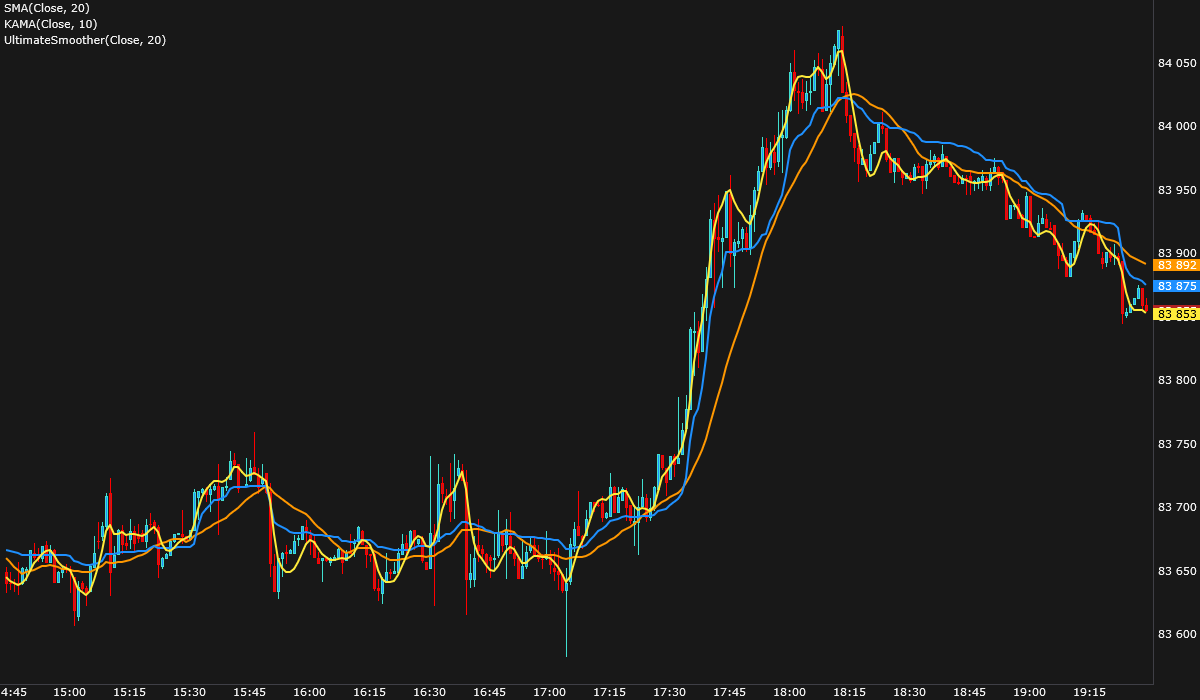
What the picture shows:
- In the range (15:00–17:20) KAMA is almost flat, UltimateSmoother follows every wave, and SMA runs through the middle with a delay.
- On the impulse (17:25–18:10) UltimateSmoother follows the bar prices, KAMA speeds up a few bars late, and SMA lags the most — the close moved up to 161 ticks away from it.
- At the reversal (around 18:10) UltimateSmoother turns first and SMA last; but after the reversal UltimateSmoother keeps oscillating along with the price.
None of the three lines is “better”: each answers its own question — where the price is without the noise (SMA), whether a directional move is under way (KAMA), where the price is right now minus the small ripples (UltimateSmoother).
Crossovers
A crossover of two averages is a change of sign of their difference: the fast average minus the slow one is essentially the MACD line (see the Oscillators lesson). A crossover of the price and an average is a change of sign of the price’s deviation from it. Both events lag by the lag of the averages, and in a range-bound market they happen many times in a row: in the picture above, from 15:00 to 17:20 the one-minute close crossed SMA(20) 19 times, and during the 17:25–18:10 impulse not once. That is why crossovers are more useful as a direction filter than as an entry signal: in a range (KAMA flat, lines intertwined) they are skipped, and in a trend you keep in mind that the first part of the move is already over by the time of the crossover.
The average as a level
Many traders watch the same averages — 20, 50, 200 periods — so orders sometimes gather near them. But the formula itself places no orders: the price often goes straight through an average. A touch of an average is a reason to look at what is happening at that price in the order book, the tape and the footprint, and to decide by the reaction, not by the line itself.
In the JetScalp terminal
All average types, the price source and the shift are in the MovingAverage indicator; the volume average is in the Volume indicator.
Summary
- In a steady trend SMA, EMA and WMA lag by , and bars; an EMA is faster only on a jump.
- KAMA slows down in noise and speeds up on a clean move; Ehlers’ and Kalman filters reduce lag at the cost of residual swings and overshoots at reversals.
- A crossover of averages is a change of sign of their difference; in a range-bound market it repeats many times, so it is used as a direction filter.
- At an average used as a level, watch the price’s reaction — volume, delta, the order book — not the line itself.
Check yourself
- Why does EMA(20) lag the price in a steady trend as much as SMA(20)?
- What happens to KAMA if the price moves in a narrow range for the whole period?
- How is a crossover of SMA(12) and SMA(26) similar to a change of sign of the MACD line?