The footprint chart
A footprint chart, also known as a cluster chart, shows inside each bar how much volume traded at each price and on which side the aggressors were. A candle tells you where price was; a footprint tells you where and how the market traded. This is what footprint (cluster) analysis is built on: you see not only the result of a bar but also at which prices buyers and sellers were more active. This is a practice-level lesson: how a footprint is built, how to read it, which pictures to look for, how to choose the cluster step and how to set up the footprint and its alerts in JetScalp.
From candle to footprint
A candle holds five numbers; a footprint holds the whole distribution of the bar’s trades by price. Each footprint row is one price (or several adjacent prices if the cluster step is larger than the tick size), and it holds two numbers:
- Bid — the volume of aggressive selling: sellers executed against buyers’ orders, at the bid price;
- Ask — the volume of aggressive buying: buyers executed against sellers’ orders, at the ask price.
How a footprint is assembled from trades is shown step by step in the lesson Candles and timeframes: the same footprint is built there to the right of the candle. A footprint is built the same way on any market where the aggressor side of each trade is known: Moscow Exchange futures and shares as well as spot and perpetual contracts on crypto exchanges.
How to read a bar
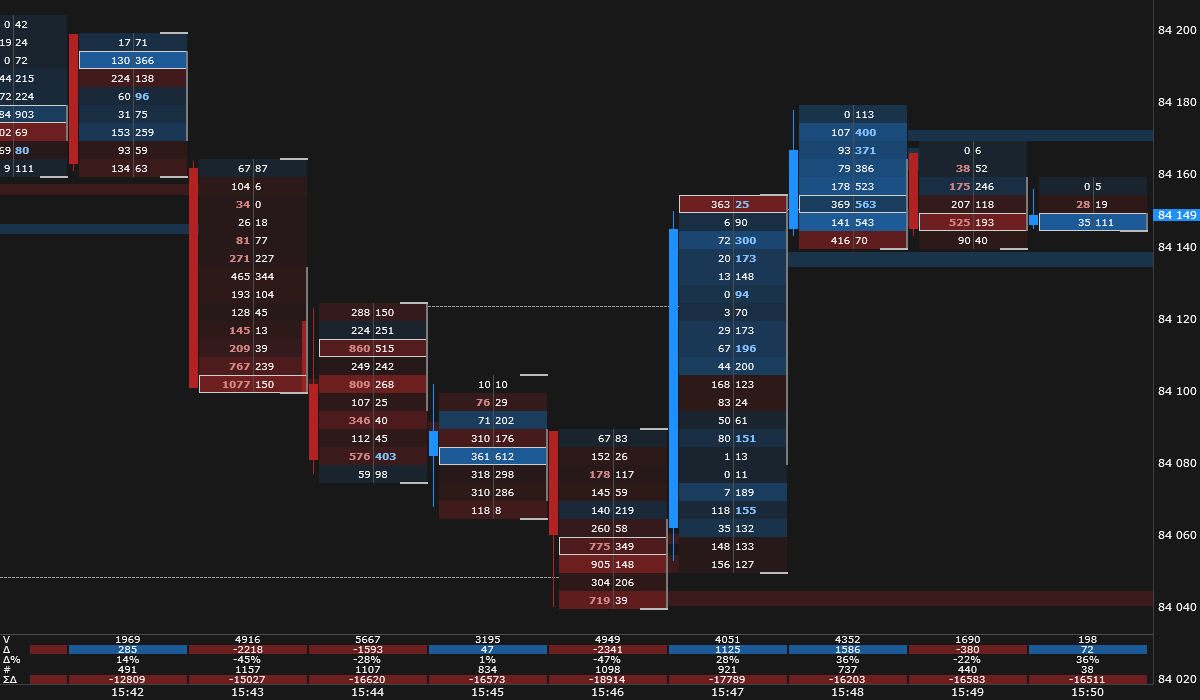
The picture shows one-minute bars of USD/RUB futures. In each row, sells are on the left and buys on the right; the background color follows the row delta (buys minus sells), and its saturation follows the delta’s size.
- The frame marks the row with the bar’s largest volume — the bar POC (point of control): the price at which most trading took place in this bar.
- The vertical line at the right edge of the bar is the bar value area: the price range where 70% of the bar volume traded (how it is calculated is covered in the lesson Volume profile).
- Bold numbers are imbalances: the side that outweighed the other side in the neighboring row (lesson Imbalances).
- The table below the bars shows volume, delta, delta in percent, the number of trades and the cumulative delta since the start of the day (lesson Delta and CVD).
Look at the 15:44 bar: a falling bar with its POC at the 860 × 515 row in the upper part, while in the lower half sells of 809, 346 and 576 stand against buys of 268, 40 and 403. This is a fact: at these prices aggressive sellers executed more than aggressive buyers. The statement “sellers ran out of steam” or “buyers held the level” is already an interpretation: you check it against what price did next and against the context — the level, the market regime, the neighboring bars.
Display modes
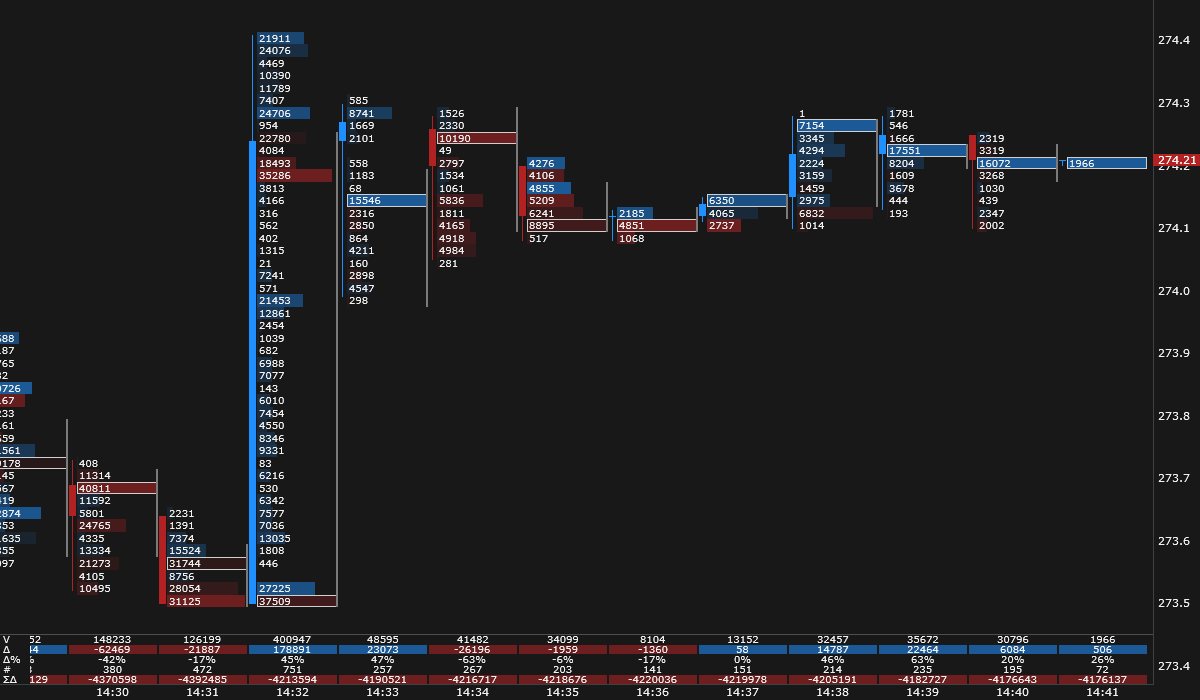
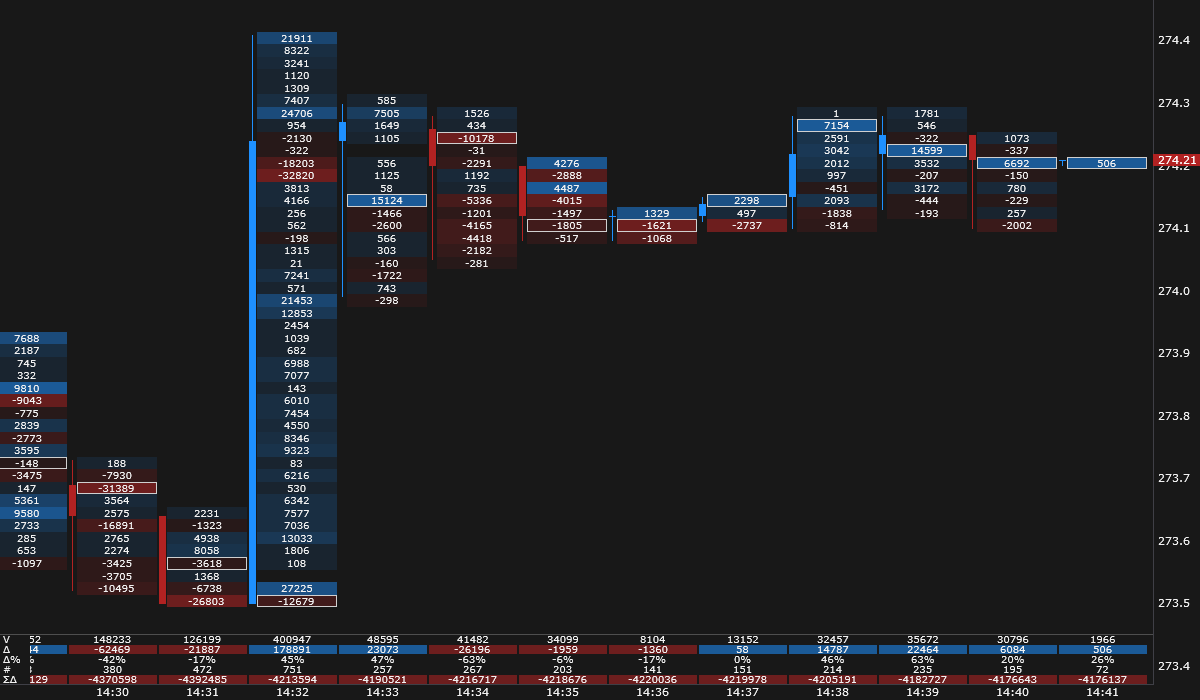
The same data can be shown in different ways. Below is the same instrument in two modes: row volume and row delta.
| Mode | Best for |
|---|---|
| Bid × Ask | Both sides at each price: where one side outweighs the other. The usual starting point. |
| Volume | Where volume is concentrated inside the bar — the “body” and the “tails” of the distribution. |
| Delta | Where the aggressors of one side dominated. |
| Heatmap, histograms | The picture at a small zoom, when the numbers do not fit. |
Typical pictures
Below are the pictures traders look for in a footprint most often. Each describes what happened to executed trades; a single sign is a reason to take a closer look, not a signal to trade. Read it together with the level, the market regime and your risk.
- Pressure at the edge of a bar. Large buys at the high or sells at the low show where one side pushed hardest. What matters is where the bar closed relative to that row.
- Absorption. At a new high there is a row with a large volume of buys, yet the bar closed below it: aggressive buys executed against sellers and price did not get through. At a low it is the mirror image. In detail — lesson Absorption and exhaustion.
- Exhaustion. Price made a new high, while the buys on the last rows towards it decline and the extreme row is almost empty: the extreme was reached with ever smaller aggressive buying.
- Stacked imbalances. Several imbalances of one side in consecutive rows: at several prices in a row the aggressors of one side outweighed the opposite side many times over. A buy stack is often treated as a future support zone, a sell stack as resistance (lesson Imbalances).
- Unfinished auction. Both buys and sells traded at the bar’s high or low: trading at the extreme price did not finish, and price often comes back to such prices.
- Delta against price. The bar rises while its delta is negative (or vice versa) — a reason to look at where inside the bar the delta was made and who was on the passive side.
Cluster step
A footprint row can combine several ticks. The larger the cluster step, the fewer the rows, the bigger the numbers in them and the coarser the picture:
- a fine step (one tick) shows exactly where the volume traded, but a volatile bar has dozens of rows and small numbers;
- a coarse step smooths the picture and helps you see where volume is concentrated, but hides the details at the edges of the bar.
Imbalances and other markings depend on the step: an imbalance visible on one-tick rows can disappear on five-tick rows, and vice versa. So markings from different charts can only be compared at the same step.
Choosing the step and the timeframe
The number of rows in a bar is the bar’s range divided by the cluster step. A footprint is easiest to read when a typical bar has 8–15 rows: fewer, and the footprint turns into two or three rows that add little to the candle; more, and the numbers get too small to fit. Hence the procedure: see how many ticks a bar of the chosen timeframe usually covers and divide by 10.
Starting points for the Moscow Exchange (the Cluster step, ticks parameter):
| Instruments | Timeframe | Step |
|---|---|---|
Liquid shares with a small tick (SBER, GAZP, NVTK) | 1 min | 1 |
| The same | 5 min | 2 |
Higher-priced shares (LKOH, T, VTBR) | 1–5 min | 1 |
Less active shares and futures (ROSN, TATN, PLZL, CR) | 5 min | 1 |
Instruments with a large tick (GMKN, MAGN, CNYRUBF) | 5–15 min | 1 |
The “slowest” ones (SMLT, IMOEXF, USDRUBF, NG) | 15 min and more | 1 |
| Currency futures Si, Eu | 1 min | 2–5 |
| The same | 5 min | 5 |
| The same | 15 min | 10 |
| Brent BR | 1 min | 1 |
| Index futures MX, RI | 5 min | 1 |
| Gold GD | 5 min | 3–5 |
In the first trading hour and on news, bars are 2–3 times wider than usual — there will be more rows, and that is fine. On instruments with a large tick a one-minute footprint is two or three rows; there a volume profile over an hour or a day (the Volume profile preset) or a higher timeframe is more useful.
Crypto. Popular pairs have a tick that is very small relative to the moves: a one-minute BTC or ETH bar covers tens to hundreds of ticks. So on crypto exchanges the cluster step is usually set to tens or hundreds of ticks — enough to get 8–15 rows per bar again — or you start with the automatic step and then fix a suitable value.
Automatic step
Cluster step 0 picks the step by zoom: rows get coarser as you zoom out. This is handy for an overview, but bars at different zoom levels cannot be compared row by row, and lot-based thresholds (Hide values below, Imbalance from volume) apply to the merged rows. To work at one zoom level, set the step explicitly. Zones until touched, past day levels and cluster search use the instrument’s tick size when the step is automatic, so they do not depend on the zoom.
Basic settings
The settings below are a convenient starting point for reading the footprint; then tune them to the instrument and your trading style.
| Parameter | Value | Why |
|---|---|---|
| Preset | Bid × Ask for order flow on 1–5 minutes; Volume profile for a day overview; Compact at a small zoom | A preset only changes the cell view and the markings; the data are the same. |
| Cluster step, ticks | from the table above | 8–15 rows in a typical bar. |
| Hide values below | 0 or a small number of lots | Removes small numbers from the screen so the large ones read faster. |
| Highlight values from | a volume that is notable for the instrument | Large cells turn bold and stand out at a glance. |
| Imbalance from volume | at least a few lots (contracts) | With 0, a 3-against-1 “imbalance” is one or two trades; on thin rows there are far too many such marks. |
| Imbalance threshold, % and Stacked imbalance, rows | 300 and 3 (defaults) | A good starting point; raising the thresholds keeps only the most notable marks. |
| Cluster history bars | 3,000–5,000 for one-minute bars | A MOEX trading day is about 1,000 one-minute bars with trades, crypto exchanges trade around the clock — 1,440 one-minute bars a day; the default 1,500 is about one to one and a half days. |
| Past day levels | 1–5 days, with VAH and VAL | The POC and value area of past days are common levels where price reacts. |
| Large trades | automatic, 50 average trades | An order 50 times the average trade is rare, so there are few marks and they are readable (lesson Large trades). If there are too many or too few marks, change the multiplier. |
| Bar signals | defaults: window 20, 2.5σ | Mark bars with abnormal volume and delta, divergence, absorption and exhaustion. |
Past day levels, large trades and bar signals also work on a candlestick chart — you do not need to switch to the Footprint view for them.
What a footprint does not show
- The passive side. A footprint shows executed aggressive trades, but not how many limit orders were resting and how many were canceled — that is visible in the order book.
- The order within the bar. Rows are grouped by price, not by time: a footprint does not tell what came first — the buys at the top or the sells at the bottom.
- The participants. The volume at a price can be one large order or a thousand small ones.
In the JetScalp terminal
Footprint on the chart. Click Chart type on the chart’s main panel and choose Footprint or a ready-made preset in the Footprint presets submenu. Cell mode, cluster step, thresholds and markings are easiest to set in the Footprint builder: the settings are shown right away on a sample chart, and a set you like can be saved as your own preset. All of this is covered in Footprint.
Footprint alerts. The terminal can tell you about the pictures from this lesson by itself — the alert arrives in the Notifications window with a sound, works in any chart view and even when the window is minimized:
- Alert: new zone and Alert: price returned to a zone — about stacked imbalances and unfinished auctions (Zone alerts);
- Alert: bar signals — about a closed bar with abnormal volume or delta, delta divergence, absorption or exhaustion (Bar signals);
- Alert: cluster found — about a cell that meets your conditions, for example volume of 500 lots or more at the bar’s high (Cluster search);
- Alert: price reached a level — about a touch of a past day’s POC, VAH or VAL (Past day levels);
- Alert: large trade and Alert: sweep (Large trades).
Tip: If the new zone alert fires too often on an active instrument, raise Imbalance from volume or Stacked imbalance, rows — only notable stacks will remain.
Footprint in the order book. In the order book window, clusters sit next to the tape and the book: volume, delta or Bid × Ask by price for the chosen timeframe — Clusters area; the cell scale and threshold — Cluster tab.
Summary
- A footprint is the distribution of a bar’s trades by price, split into aggressive sells (Bid) and buys (Ask).
- The bar POC is the price with the largest volume; the bar value area is where 70% of the volume traded.
- Absorption, exhaustion, stacked imbalances and unfinished auctions are pictures for reading the market; read them together with the level, the regime and your risk.
- Choose the cluster step so that a typical bar has 8–15 rows; compare charts at the same step.
- A footprint shows aggressive executions, but not passive liquidity, the order within the bar or the participants.
Check yourself
- What do the numbers 809 and 268 in a footprint row mean in Bid × Ask mode?
- A one-minute Si bar usually covers about 25–30 ticks. How many rows will it have with a cluster step of 1 and of 3?
- Why does the Imbalance from volume threshold behave differently at different zoom levels when the step is automatic?
- Why can a footprint not tell you what came first inside a bar — buys near the high or sells near the low?