Imbalances
An imbalance in a footprint is a price at which one side of aggressive trading outweighed the other many times over. It is a quick way to find the places in a bar where the aggressors of one side dominated. This is a practice-level lesson: how a diagonal imbalance is calculated, what stacked imbalances and an unfinished auction are, and how to read them.
Why diagonal
An aggressive buy executes at the ask, an aggressive sell at the bid, and the ask is one tick above the bid. So buys at price and sells at the same price happened under different states of the order book. The comparison is made diagonally: a row’s buys against the sells of the row one step below, a row’s sells against the buys of the row one step above. This compares aggressors who, at the same moment, faced each other across the spread.
There is an imbalance if one side is at least the threshold of the other: 300% by default in the terminal, that is, three times as much. The lowest row of a bar has no row below it, so it never has a buy imbalance; the highest row never has a sell imbalance.
More: the imbalance condition as a formula
Here is buys (Ask), is sells (Bid), and is the threshold (300% means ).
Threshold, minimum volume and zeros
Three settings strongly change the number of imbalances:
- Threshold — how many times one side must outweigh the other. At 150% there are many imbalances, at 400% noticeably fewer.
- Minimum volume of the outweighing side. Without it, 3 lots against 1 becomes an “imbalance” — one or two trades.
- Imbalance against zero. If the opposite side is empty, the ratio is infinite. Whether to count it as an imbalance is a decision, not a fact: at the edge of a bar, an empty side often just means that price was there for an instant.
The number of imbalances on a chart is largely a consequence of the settings. Before drawing conclusions about “buyer strength”, check at what threshold and minimum volume the imbalance appeared at all. Where to start when tuning for an instrument — lesson The footprint chart.
Stacked imbalances
A stack is several imbalances of the same side in consecutive rows (three or more by default in the terminal). A stack means that at several prices in a row the aggressors of one side outweighed the other side many times over. In footprint practice, a buy stack is often seen as future support and a sell stack as resistance: the assumption is that when price returns to this zone, the same side will show interest again.
The data show that, when the stack formed, one side dominated at these prices. What happens when price returns — a bounce, a stall or a pass straight through — is decided by the current flow: watch how the tape and the order book behave as price approaches the zone.
Unfinished auction
If both buys and sells traded at a bar’s high (low), this is called an unfinished auction: at the extreme price trades went both ways, and the auction there is considered “not finished”. If trades at the extreme price went only one way (zero on the other side), the auction is considered finished. In footprint practice, price often returns to unfinished auctions, so they are marked as possible targets.
Zones until touched
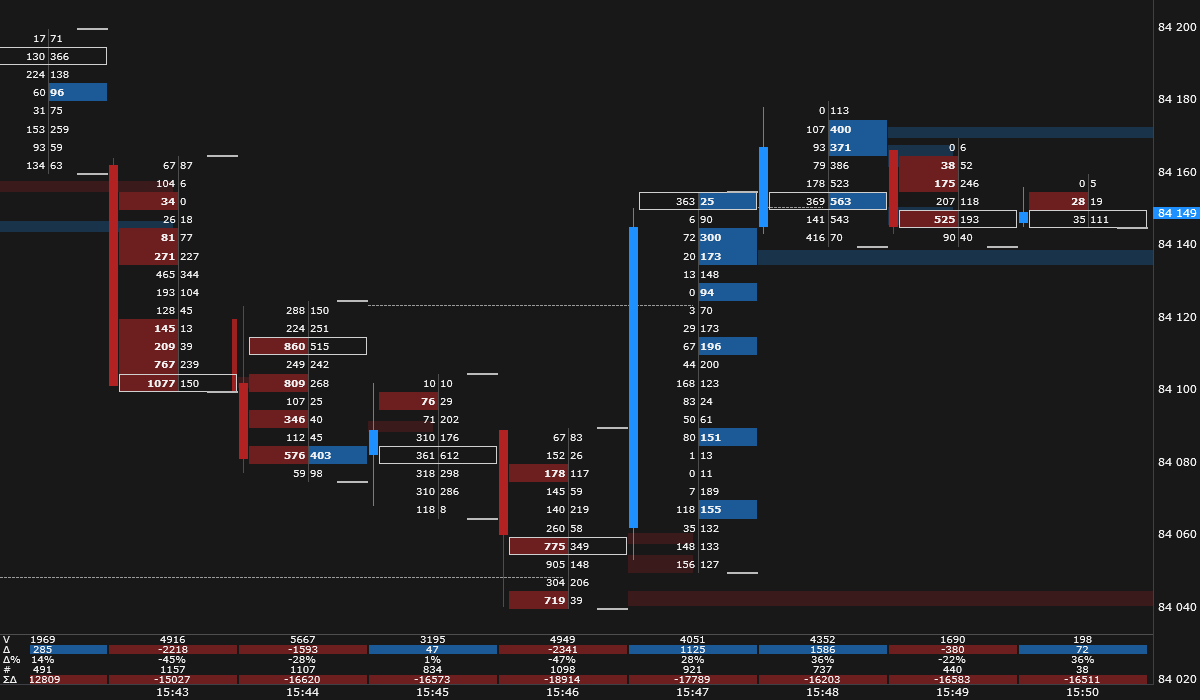
The terminal extends stacks and unfinished auctions of closed bars to the right until price returns to them — these are the bands and dashed lines in the picture. It is a convenient way to see “untested” places; the zone itself does not tell what will happen on a touch — that is decided by the flow at the moment price arrives.
How to read imbalances
An imbalance answers the question “where did one side dominate in executed trades”. To make it useful, look at it in context:
- where the imbalance is in the bar — at the edge in the direction of the move it often appears at the end of a push, when the last aggressors are chasing price; in the middle of the bar and at a level it tells more;
- whether the bar has closed — a stack is final only after the bar closes;
- where the level is and what the regime is — a buy stack above a broken level and a stack at the edge of a range read differently (lesson Market regimes).
A single imbalance is a reason to take a closer look; read it together with the level, the regime and your risk.
In the JetScalp terminal
Imbalance thresholds, minimum volume, imbalance against zero, stack length, unfinished auctions and zones until touched — see Footprint. The ready-made Imbalance preset turns this markup on with one choice.
Alert: new zone reports a closed bar with a stack or an unfinished auction, Alert: price returned to a zone — the first return of price to it (Zone alerts).
Tip: On an active instrument with the default thresholds there are many stacks a day, and the new zone alert may sound often. For alerts, raise Imbalance from volume or Stacked imbalance, rows — only notable stacks will remain.
Summary
- An imbalance compares a row’s buys with the sells of the row below (and vice versa) — aggressors on opposite sides of the spread.
- The number of imbalances is set by the threshold, the minimum volume and the rule for zeros.
- Stacks and unfinished auctions are places where one side dominated and where trading was left unfinished; price often returns to them, and what happens on a touch is shown by the current flow.
- Read an imbalance together with its place in the bar, the level and the market regime.
Check yourself
- Why are a row’s buys compared with the sells of the row below and not of the same row?
- Buys of 30 lots, sells one step lower — 0. Is this an imbalance, and which settings does the answer depend on?
- Why does a buy stack not guarantee that price will hold at it on a return?