What indicators measure
An indicator is a formula of past prices, volumes and trades. It extracts one aspect of a move that has already happened — direction, size, the price’s position in a range, volume — and shows it on a convenient scale, so it is easy to compare from bar to bar and across instruments. A price indicator does not see the order book, orders or participants’ intentions: for those there are the order book, the tape and the footprint. This is a practice-level lesson: which transforms indicators are built from, what you pay for a smooth line, and why three similar indicators are not three confirmations.
Five transforms
Almost every indicator in the terminal is built from a few simple operations on a series of prices or volumes:
| Transform | Effect | Examples |
|---|---|---|
| Smoothing | Averages the latest values, suppressing small fluctuations. | MovingAverage, KAMA, Ehlers filters |
| Difference | Compares the current value with a past one, or two averages with each other. | price change, MACD, TSI |
| Normalization | Brings a value to a common scale: 0–100, ±1, “how many standard deviations”. | RSI, Stochastic, RobustZScore |
| Dispersion | Measures the size of a move, not its direction. | ATR, Bollinger Bands, Volatility |
| Accumulation | Adds up values from the start of a period. | VWAP, cumulative delta |
For example, RSI is a difference (bar-to-bar price changes) split into rises and falls, smoothed and normalized to a scale from 0 to 100. MACD is the difference of two smoothings. Once you know what an indicator is built from, it is easy to see what it will show in a trend, in a range-bound market and on a spike — without memorizing “signals”.
Lag and noise
Any smoothing over past bars lags. In a steady trend, a simple average of bars lags the price by bars: a twenty-bar average by nine and a half. A long average is calmer but notices a reversal later; a short one is faster but jerks along with the noise. You cannot reduce both for free: low-lag filters pay for it with residual noise or by overshooting the price at reversals (see the Moving averages lesson).
Thin line — the price, dashed — the signal without noise, colored — the average
The series is synthetic: the signal is known, so the lag and the noise can be measured. The lag is the shift at which the average is closest to the signal; the noise is the root mean square distance to the signal at that shift. "On a straight trend" is the lag on a clean straight line; for KAMA it holds only without noise: noise slows it down. The period of SuperSmoother and UltimateSmoother is the filter's cut-off period, not a window length.
The same is true of every indicator with smoothing inside: RSI(14), ATR(14), MACD(12, 26, 9). The period is not “tuning to the market” but a choice between lag and noise.
Scales and conventional levels
A normalized indicator is easy to read, but its scale is deceptive:
- 0–100 is not a probability. RSI 80 does not mean “80% in favor of a rise”: it is the share of rises in the smoothed movement of the last bars.
- The 70 and 30, 80 and 20 levels are a convention. They do not follow from the formula, and the share of bars beyond a level depends on the instrument and timeframe (see the Oscillators lesson).
- A bounded scale sticks to its edge. In a strong move Stochastic sits at 100 for hours and LaguerreRSI at 1; this is not a signal but a property of normalization (see the Oscillators lesson).
Repainting and the forming bar
An indicator whose values on past bars change retroactively looks better on history than it was in real time. There are two cases:
- The forming bar. Until a bar closes, its close is the price of the last trade, and any close-based indicator on this bar changes with every trade. A signal “on the current bar” can appear and disappear before the close.
- Swing points confirmed later. A fractal is placed on a bar only once two more bars have closed to its right (with period 5): in real time you see it two bars late. ZigZag pulls its last segment along with the price, and its outermost swing point keeps moving until the next reversal forms.
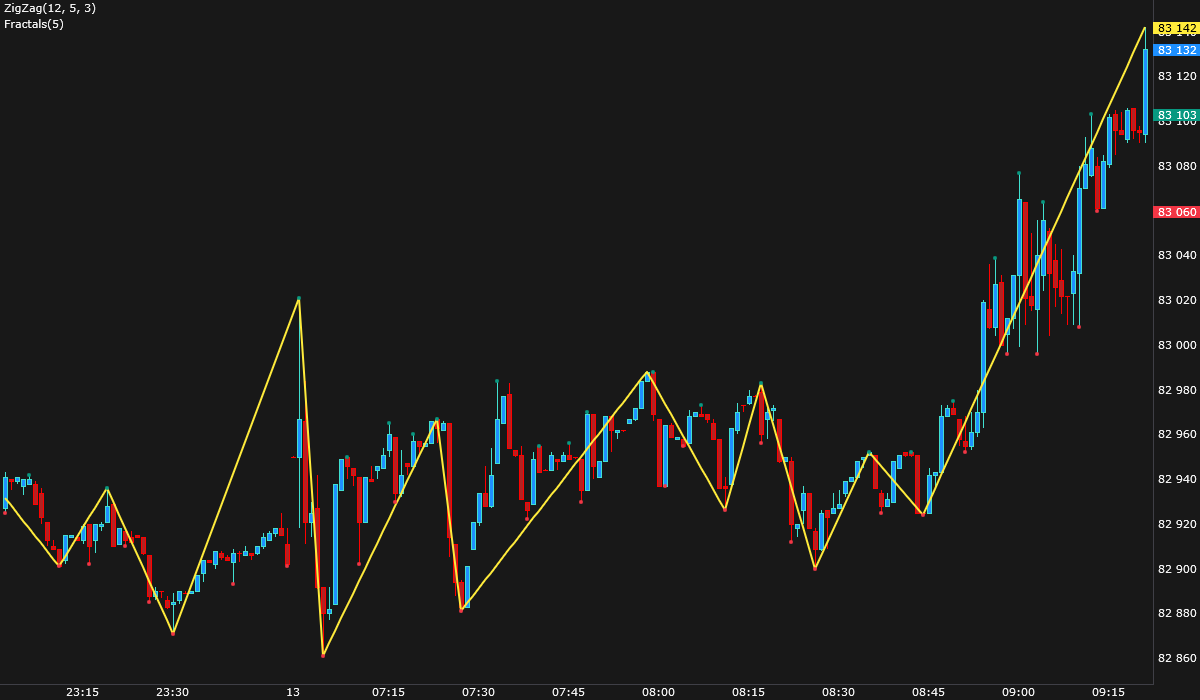
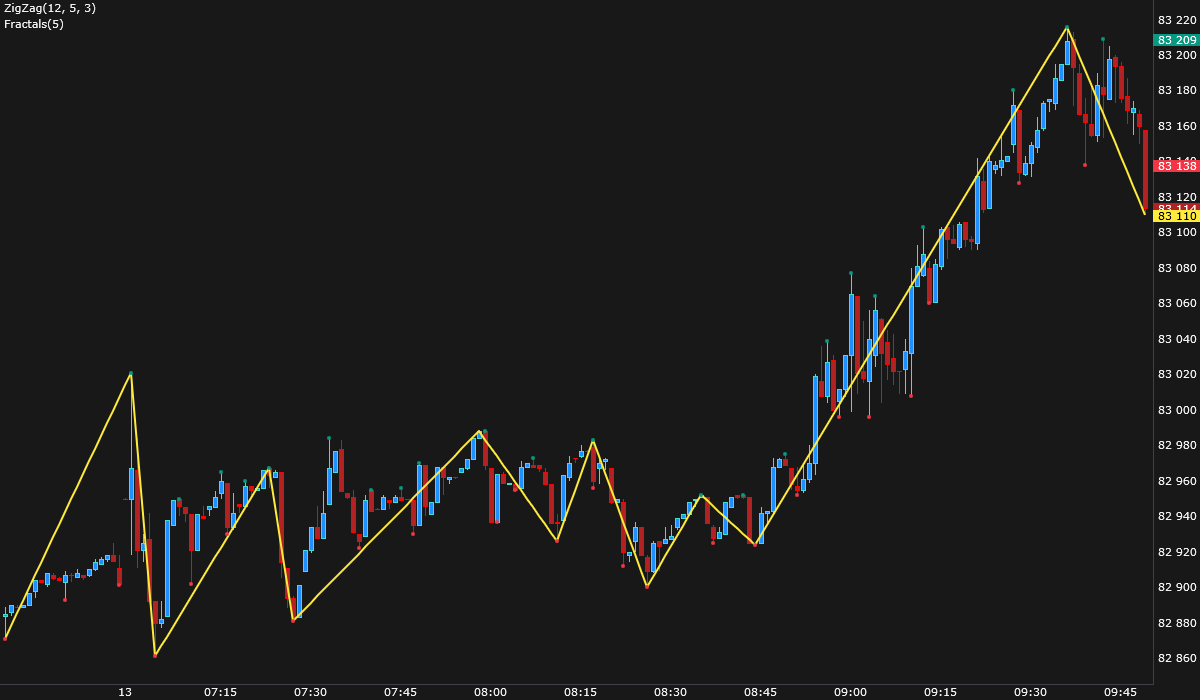
That is why signals based on ZigZag peaks cannot be tested on history “as drawn”: at the moment of decision the line looked different. Shifting a line to the right (the Shift parameter of MovingAverage) adds no information — it only draws the same value a few bars later.
Similar indicators — the same information
If two indicators are built from the same closing prices with similar transforms, their agreement confirms almost nothing. Indicators of one family largely repeat each other:
- RSI(14) orders the bars almost the same way as the simple price change over the same 14 bars: it is mostly the same change on a different scale. RSI and Stochastic are just as close.
- TSI and MACD are almost indistinguishable: both are a smoothed price difference.
- Indicators differ most when they have different horizons, not different formulas: the 5-bar and 14-bar changes are less related than RSI is to TSI.
So “RSI above 70, Stochastic above 80 and MACD rising” is one observation (the price rose over the last half hour) written down three times. A good combination is indicators that measure different things: direction, dispersion (ATR), volume (RelativeVolume), position relative to a level (VWAP, day levels). Each answers its own question, and together they give a picture.
Parameters
Periods of 14, 20, 26 are a tradition, not a property of the market. Try several periods on history and you can always find the “best” one — and it almost always turns out to be the best only on that history. A useful rule: change a parameter to change the horizon (minutes, hours, a day), not to improve past signals.
In the JetScalp terminal
All indicators, their formulas and parameters are in the Indicators section; adding and configuring them is described in Indicator manager.
Summary
- An indicator is a transform of past data: smoothing, difference, normalization, dispersion, accumulation. It extracts one aspect of a move that has already happened and shows it on a convenient scale.
- Smoothing is always a choice between lag and noise.
- 0–100 scales are not probabilities; the 70/30 levels are a convention.
- Values on the forming bar and ZigZag peaks change retroactively; fractals are confirmed with a delay.
- RSI, Stochastic, TSI and MACD are very similar: their agreement is one observation. Combine indicators that measure different things.
Check yourself
- Which transforms is MACD built from, and what will it show in a steady trend?
- Why can the signal “RSI left the overbought zone on the current bar” disappear before the bar closes?
- You see RSI, Stochastic and MACD all showing a rise at the same time. How many independent observations do you have, and why?