Time and sales
Time and sales (the tape) is a list of all executions in an instrument in time order: time, price, volume and the aggressor side. Unlike the order book, the tape is what has already happened. This is a practice-level lesson: how one order turns into several lines on the tape, how to tell an ordinary trade from a large one, and what the tape tells a scalper.
A trade is not an order
Each line of the tape is a trade: the execution of an aggressive order against one resting limit order. One aggressive order that went through three limit orders at two levels produces three lines with the same time on the tape (see the 150-lot example in the lesson How price is formed). Therefore:
- the number of trades depends not only on how active buyers and sellers are but also on how fragmented the opposing orders in the order book are;
- trade size is not the size of the aggressor’s order: a large order filled against many small ones looks like a stream of small trades on the tape.
The aggressor side
The exchange knows whose order came second and executed immediately — that party is the trade initiator. On the MOEX and crypto exchange tapes the side comes with the trade, and the terminal colors aggressive buys and sells differently. In markets where the side is missing, it is reconstructed with rules like “a trade at the ask is a buy”, and some trades get misclassified. The aggressor side also builds delta — aggressive buying minus aggressive selling, covered in the part on volume analysis.
Bursts: one order, many lines
If several trades of the same side with the same time down to the millisecond follow one another, this is almost certainly one aggressive order executing against several opposing ones. The tape has no order IDs, so this is an estimate: two different orders of the same side could have arrived in the same millisecond.
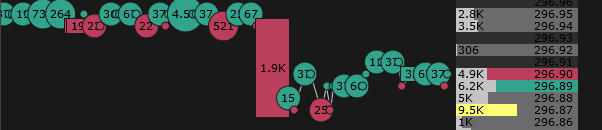
In liquid instruments such bursts are routine, and they account for a noticeable share of the volume. Hence a practical rule: before judging the size of an order from the tape, join consecutive same-side trades within one millisecond into one. JetScalp does this itself — trade aggregation on the tape and joining an order’s trades for large trades on the chart.
Trade size
Trade sizes are distributed very unevenly. A typical trade is small, and most of the volume goes through a few large ones: the “average” trade on the tape is small, but the market is moved by a few large executions. That is why large trades are worth highlighting — they are the trace of participants who need to get filled now.
The “large trade” threshold cannot be one number for all instruments: 300 shares of a liquid stock is nothing unusual, while 300 futures contracts may be a rare trade. It makes sense to set the threshold relative to the typical trade size of the particular instrument — this is how the terminal’s automatic large-trade threshold works: a given multiple of the average trade.
Sweeps
A sweep is an aggressive order that went through several price levels at once: on the tape it is a burst of same-side trades with the same time and rising (for a buy) prices. A sweep is the most direct trace of urgency: someone was willing to pay several ticks just to get filled immediately.
A sweep at an important level — a breakout, an exit from a range, a new high of the day — is a reason to take a closer look: will the push continue, or will the opposing side absorb it? A single sign is a reason to take a closer look; read it together with the level, the market regime and your risk.
What the tape won’t show
- Canceled orders. The tape shows only executions; what left the order book without trades is visible only in the order book itself.
- The passive side. Which limit order was filled and how many more were standing behind it is visible in the order book, not on the tape.
That is why the tape is read together with the order book: the tape shows the push, the book shows how much stands against it (see The order book).
In the JetScalp terminal
- The tape in the order book window — Tape area; its settings, trade aggregation and a sound alert for a large trade — Tape tab.
- The separate Tape window shows every trade in a table, and the volume filter keeps only the large ones.
- Large trades and sweeps on the chart, their threshold and alerts — Large trades on the Footprint page.
Summary
- A line on the tape is a trade, not an order: one aggressive order produces a burst of lines; they are joined to see the whole order.
- A typical trade is small, while volume is concentrated in a few large ones; the large-trade threshold is relative.
- A sweep is a trace of urgency; at an important level it is a reason to take a closer look.
- The tape shows the push, the order book shows what stands against it; read them together.
Check yourself
- Why does the number of trades per minute poorly reflect the number of participants who traded in that minute?
- Why are trades joined into bursts before analyzing trade size?
- Why is a fixed “large trade” threshold of 500 lots unsuitable for all instruments?