Breakouts and momentum
The idea of a breakout: while price is in a range, buyers and sellers are balanced; a move beyond a boundary says one side has taken over, and the move may continue. Momentum is a sharp move on unusual volume that late participants join. This is a practice-level lesson: the opening range breakout, momentum adjusted for the time of day, false breakouts and the terminal tools for them.
Important: The examples in this lesson review the past and are not trade signals. Every entry needs a stop loss and a position size calculated from risk.
Idea
Stop losses and pending orders usually sit at a range boundary. When price reaches them, their execution pushes it further, and new participants join the move that has started. The flip side is a false breakout: price goes a few ticks beyond the boundary, triggers the stops and comes back. The breakout approach accepts this as its price: some entries close with a small loss at the boundary, while successful breakouts give a move several times larger than the risk.
When it fits
- Before the breakout price is compressed: the bar range narrows, Squeeze shows a squeeze, price presses against the same level several times.
- The boundary is visible to everyone: the opening range high, the previous day’s high, a large resting order in the order book, the previous day’s VAH.
- At the breakout, activity is above normal for this time of day.
Breakouts work worse on a slow day without participants and in the middle of a wide range, where the boundary is blurred.
Opening range breakout
The opening range is the high and low of the first minutes of the trading day. The boundaries are clear, and the rule is easy to write down in advance.
| Part | How to define it |
|---|---|
| Range | The high and low of the first 15–30 minutes of the main session. |
| Signal | A bar closes beyond the range boundary. |
| Entry | After the signal bar closes or on a return to the broken boundary (retest). |
| Stop loss | Inside the range: beyond the middle of the range or beyond the broken boundary with a margin. |
| Exit | The next level (previous day’s high, POC, VAH), a trailing stop or the end of the day. |
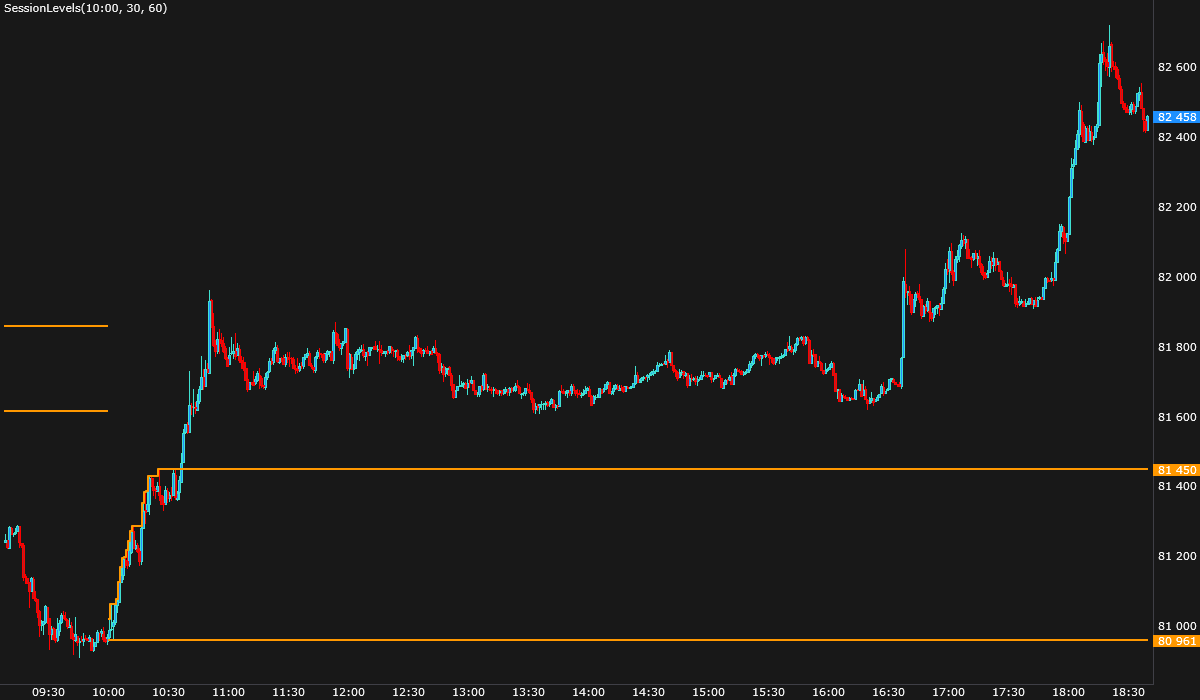
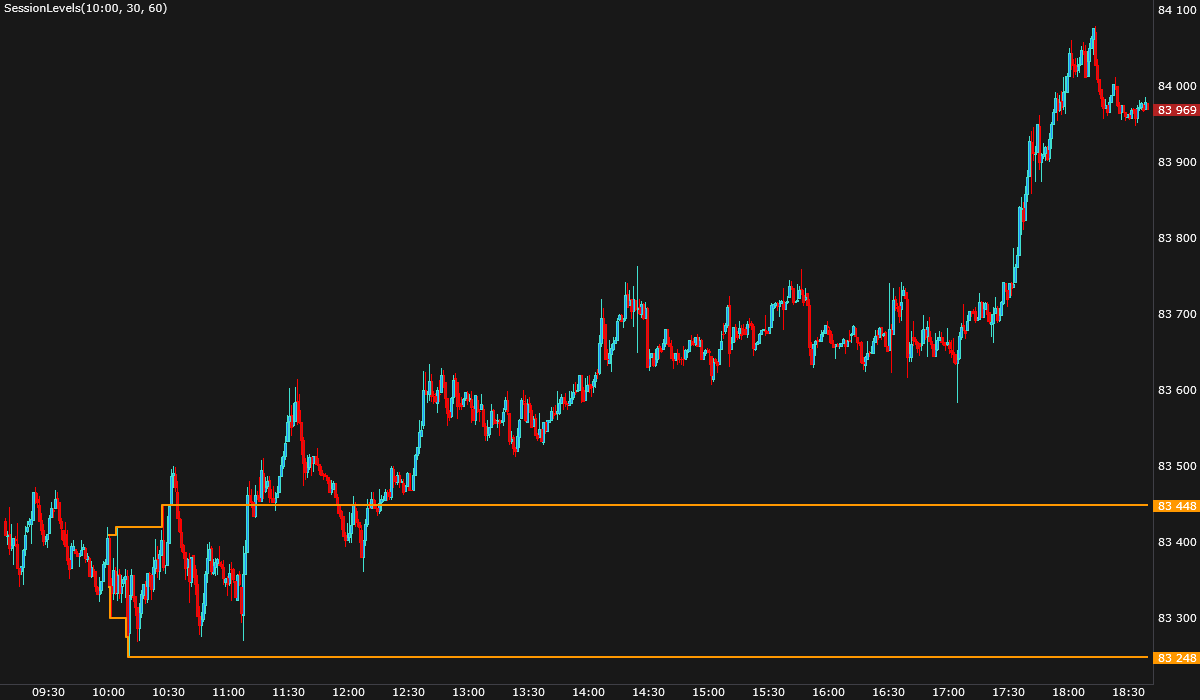
On MOEX the trading day has several “opens” — the morning and the main sessions; a range from 09:00 and one from 10:00 are different levels. Pick one and write it into your plan (lesson Intraday levels).
Momentum on unusual volume
A sharp bar on high volume often means a participant with a large size has entered the market. But volume must be compared with the same time of day: at the open it is always high, in the evening it is low. Unusual volume is volume several times above normal for this hour — that is what RelativeVolume shows.
How to read momentum:
- Start of a move: price leaves a range or a level, RelativeVolume is clearly above 1, the bar’s delta points in the direction of the move, volume drops on the pullback.
- Climax: the biggest volume arrives after a long move, the bar has a long wick, and the footprint shows absorption or exhaustion at the extreme. This is more likely the end of a move than its start.
- News and session opens: sharp bars at these moments go both ways; wait until price settles on a direction.
A single momentum bar is a reason to take a closer look; read it together with the level, the market regime and the risk.
False breakout
Signs that a breakout may not hold:
- the bar close came back inside the range;
- there is no follow-through volume beyond the boundary, and the footprint shows absorption at the boundary — aggressive buying met a seller;
- a large resting order in the order book beyond the boundary is not removed but replenished.
A false breakout is information too: after it price often heads to the opposite range boundary (lesson Ranges and mean reversion).
Stop loss and exit
- The stop loss goes inside the range, where the breakout is considered failed. A stop that is too close gets hit by retests of the boundary; one that is too far makes the loss larger than the possible profit.
- Exit — at the next notable level, by a trailing stop or in parts. A momentum trade is held while volume supports the move; when volume and delta fade, the move often runs out of steam.
- By time: if price stalls at the boundary after the breakout, the idea has weakened.
Common mistakes
- Entering before a bar closes beyond the boundary and getting caught in a false breakout.
- Chasing price after a big impulse, when the stop loss has to go far away.
- Mistaking a climax for the start of a move: high volume after a long rise calls for caution.
- Re-entering after every false breakout without a rule for how many attempts are allowed.
In the JetScalp terminal
- Opening range, Initial Balance and previous day levels — SessionLevels (set the start of the day for MOEX explicitly); the noise area for breakouts — NoiseArea; the squeeze before a breakout — Squeeze.
- Unusual volume — RelativeVolume, move size — ATR; the anomalous volume mark at a bar — the footprint’s Bar signals.
- An alert on a breakout — an alert level at the range boundary: a cloud alert reaches your phone and Telegram.
- Fast entry and exit — order book hotkeys, a stop loss right at entry — Auto stop loss.
Summary
- A breakout relies on one side taking over at a boundary; the price of the approach is false breakouts with a small loss.
- Momentum is judged by volume relative to the same time of day, not relative to neighboring bars.
- High volume appears both at the start and at the climax of a move: look at where it appeared and what the footprint showed at the extreme.
- The stop loss goes inside the range, the exit at the next level or by a trailing stop.
Check yourself
- Why can a breakout approach have a win rate below half and still be reasonable?
- Why is the volume of the 10:05 bar compared with the volume at 10:05 on previous days?
- What signs in the footprint and the order book suggest a breakout may be false?