Oscillators
An oscillator is an indicator that swings within a bounded scale or around zero: it shows how one-sided the recent move was and where the price is within its recent range. This is a practice-level lesson: which families of oscillators the terminal has, what “overbought” really means, why it lasts long in a trend, and what can and cannot be concluded from a divergence.
Families
| Measures | Indicators | Scale |
|---|---|---|
| Share of rises in the recent move | RSI, LaguerreRSI | 0–100, 0–1 |
| Price position in the recent range | Stochastic, FisherTransform | 0–100; around zero |
| Smoothed price difference | MACD, TSI | in price; ±100 |
| Momentum in volatility units | NormalizedMomentum | ±0.96 |
| Swing phase without trend and noise | RoofingFilter | in price, around zero |
RSI divides the smoothed price rise by the sum of the smoothed rise and fall. RSI 80 means that over the last bars rises made up 80% of the path traveled. It describes the recent move, not a forecast of the next bar.
More: the RSI formula
where and are the average bar-to-bar gain and loss of the close over the period (Wilder smoothing).
Stochastic shows where the close is within the High–Low range of the last bars: 100 is at the high, 0 at the low. FisherTransform takes the same position in the range and stretches the edges so that reversals look like sharp peaks. MACD is the difference between a fast and a slow EMA, TSI is the double-smoothed price change divided by the double-smoothed path. LaguerreRSI is a fast RSI on a Laguerre filter, NormalizedMomentum is three pairs of averages in volatility units, and RoofingFilter is the price without the trend and the small noise, that is, only the swings.
The same information on different scales
Most oscillators are made from the same raw material — the recent change of the closing price. RSI(14) almost repeats the simple 14-bar price change, and TSI and MACD are almost indistinguishable (the numbers are in the What indicators measure lesson). Different oscillators on one chart most often show the same observation with a different delay and on a different scale.
Overbought in a trend
Textbooks often read “overbought” as “the price is due to fall”. But RSI above 70 means only one thing: the recent move was mostly up. In a strong trend that is exactly how it should be, and the oscillator stays near the edge of its scale for as long as the move continues.
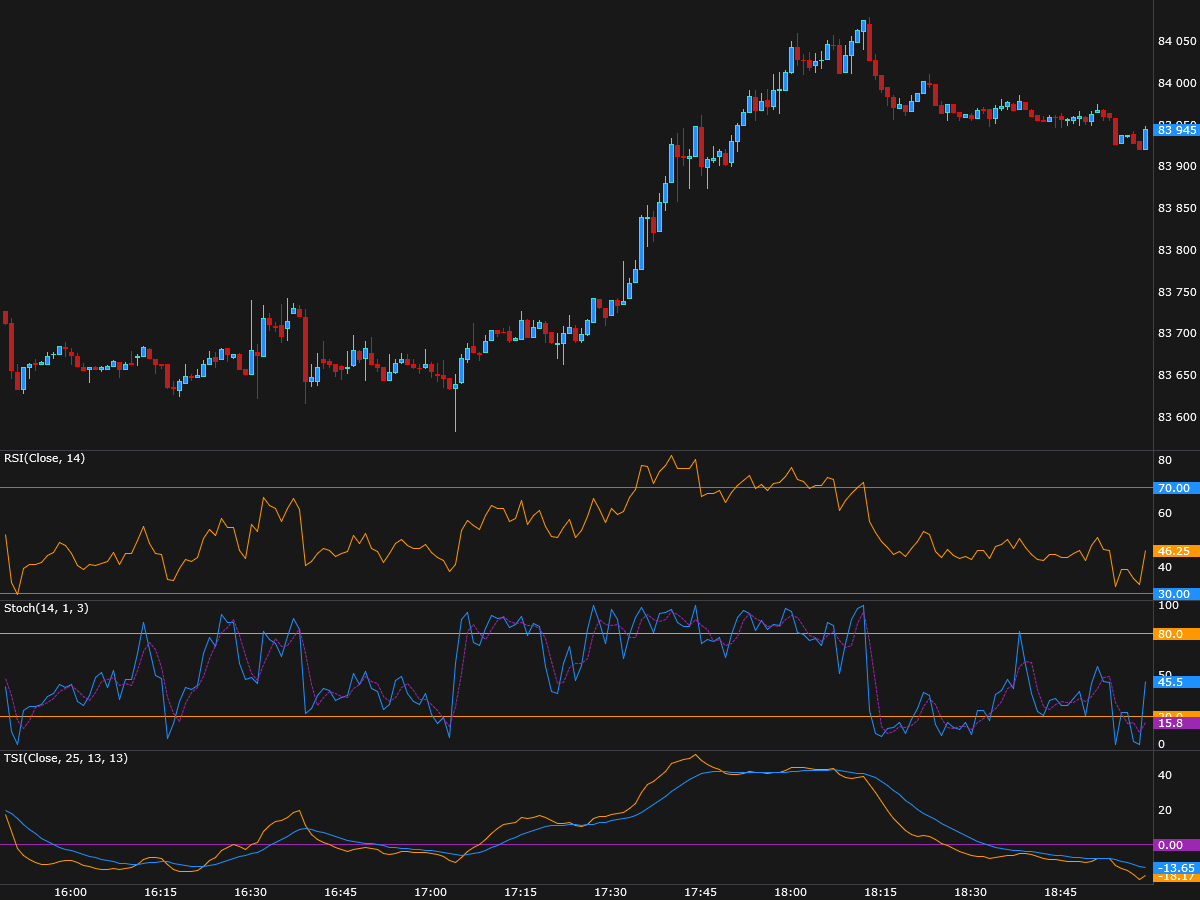
Here is how it went, minute by minute (the close and RSI(14), calculated from the day’s trades):
- 17:35 — RSI above 70 for the first time (78), close 83,840;
- 17:45 — RSI left the overbought zone (66) with the close at 83,900 — a classic “sell signal”;
- 18:12 — the highest close of the impulse, 84,076: 176 ticks above the 17:45 “signal” and 236 above RSI’s first move above 70;
- 18:19 — close 83,966: a pullback after the top.
Selling on the exit from overbought that day would have meant standing against the move for 27 minutes and 176 ticks; selling on the first move above 70, against 236 ticks. This is one example, not statistics, but it shows the mechanics: overbought lasts as long as the one-sided rise lasts.
Usually RSI goes above 70 only briefly — for a few bars. But sometimes it stays there for a long time, and these are exactly the strong moves on which selling “from overbought” costs the most. You cannot tell them apart in advance from RSI itself: at the moment of the first move above 70, a short and a long episode look the same. That is why the strength of a move is judged by volume, delta and the reaction at levels, while RSI tells you that the move is one-sided.
Divergences
A divergence is when the price makes a new high but the oscillator makes a lower high than at the previous peak (bearish), or the reverse at lows (bullish). It is read as a weakening of the move. What is true here and what is not:
- The mechanics are true: if the second wave of a rise is slower than the first, its peak on RSI and MACD is lower — this follows from the formula. A divergence is a sign of slowing.
- The conclusion “so a reversal is coming” does not follow: a move can slow down and continue, and in a trend divergences can occur several times in a row.
- Choosing the peaks is subjective: “the previous peak” and “the new high” are picked differently by eye. For a divergence to be testable, it must be defined by a rule — as is done, for example, for cumulative delta divergences in the Delta and CVD lesson.
How to use a divergence: as a warning of slowing — a reason to tighten the stop, not to add to a trend position, and to look at what volume and delta are doing at the nearest level. A single sign is a reason to take a closer look; read it together with the level, the market regime and the risk.
How to use oscillators
- Read an oscillator as a description of the recent move: how one-sided it is and where the price is in its recent range.
- The 70/30 and 80/20 levels are guides on the scale. Going beyond them in a trend is normal, not a reversal signal.
- Pick one oscillator for your question and horizon. A second one built from the same closes adds almost nothing; an indicator of a different kind is more useful — volatility, volume, time of day.
- A signal on the forming bar can vanish before the close: look at closed bars.
In the JetScalp terminal
RSI, Stochastic, MACD, TSI, LaguerreRSI, FisherTransform, NormalizedMomentum, RoofingFilter.
Summary
- Oscillators describe the recent move: the share of rises, the position in the range, the smoothed difference.
- Most of them are the same price change on different scales and with different delays.
- Overbought can last a long time in a trend — precisely on strong moves.
- A divergence is a sign of slowing, not of a reversal; without a formal rule it cannot be tested.
Check yourself
- What does RSI = 80 mean in terms of price gains and losses?
- Why can RSI leaving the overbought zone in a strong trend turn out to be a costly signal?
- You want to add a second indicator to RSI. Why will Stochastic add less than, say, ATR or volume?