Trend and its strength
A trend is when the price displacement over a chosen horizon is clearly larger than the price’s fluctuations around that displacement. “Clearly larger” can be measured in different ways, and that is why trend indicators often disagree: one sees a straight line, another large directional bars, a third a statistically significant speed. This is a practice-level lesson: four ways to measure a trend, what “strong” means in each of them, and what you pay for it.
A trend depends on the horizon
The same chart can show a rise over the day, a range over the last hour and a fall over the last ten minutes. An indicator sees a trend only within its own window: CorrelationTrend(20) on one-minute bars covers 20 minutes, ADX(14) with its smoothing about half an hour. Before arguing about “whether there is a trend”, agree on the horizon.
A trend indicator describes past bars: on one-minute bars the direction of neighboring minutes is almost unrelated (see the Volatility and anomalies lesson), so a trend on the indicator is context, not a promise about the next minute. Read it together with levels and order flow; whether moves persist on longer horizons is shown by the variance ratio (see the Market regimes lesson).
Four ways to measure a trend
| Measure | Strong trend |
|---|---|
| Slope and straightness: LinearRegression, CorrelationTrend | The price stays close to a straight line with a clear slope. |
| Directionality: ADX, +DI and −DI | Bars extend beyond the previous bar mostly in one direction. |
| Trailing line: SuperTrend, ParabolicSAR | The price has not once closed beyond a line set several ATRs away or pulled in with acceleration. |
| Confidence in speed: KalmanTrend | The speed estimate is larger than two of its standard errors. |
Slope and straightness. LinearRegression fits a least-squares line through the last bars and follows its end point — with no delay in a steady trend. CorrelationTrend is the correlation of the price with the bar number: +1 is a steady rise, around zero is a choppy market. The square of CTI is the share of the move explained by the line: at 0.9 it is 81%.
Directionality. ADX compares how far a bar went beyond the previous bar’s high (+DM) and below its low (−DM) with the true range, smooths this and looks at how much one side prevails. ADX does not know the direction — that comes from +DI and −DI; a high ADX occurs in both rises and falls. Inside are two Wilder smoothings in a row (14 and another 14 bars by default), so ADX is one of the slowest lines in the terminal.
Trailing lines. SuperTrend stays several ATRs away from the middle of the bar and moves only toward the price; a close beyond the line reverses the trend. ParabolicSAR is pulled toward the price with an acceleration that grows with every new extreme. Both lines are essentially trailing-stop rules: they do not measure strength but tell you whether there has already been a pullback large enough to cancel the direction.
Confidence. KalmanTrend estimates the speed of the price with a Kalman filter and divides it by the standard error of the estimate: above +2 or below −2, the direction stands out from the noise at the current volatility. This comes closest to the question “trend or chance”, but here too the answer is about past bars.
On a real chart
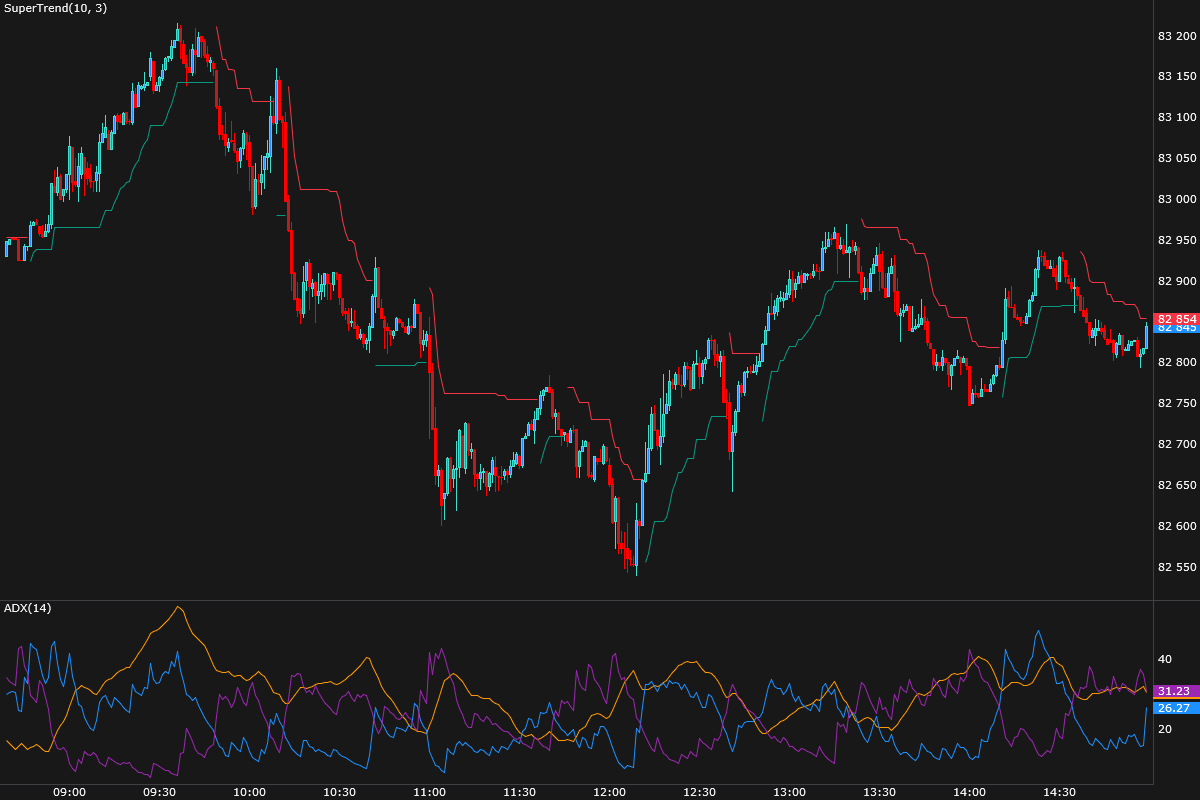
- Rise, 09:00–09:35. SuperTrend is green below the price; ADX rises and peaks around 09:35 — at the top of the rise, not at its start.
- Fall, 09:40–11:00. SuperTrend turned down a few bars after the top. At the start of the fall ADX is still declining after the rise and rises again later: it measures the directionality of the past half hour, not of the new move.
- Range after 12:00. SuperTrend changes sides several times — in a range every change means a stop in one direction and an entry in the other, with a loss of several ATRs.
Lag and false reversals
All trend indicators have a window, and many have smoothing, so they confirm a trend when part of it is already over and cancel it when part of the pullback has already happened. Parameters shift this trade-off but do not remove it:
- a larger Multiplier for SuperTrend or a smaller Step for ParabolicSAR means fewer false reversals in a range, but more is given back at a real reversal;
- a longer window for LinearRegression and CorrelationTrend gives a more stable estimate but a later reaction;
- the levels “ADX above 25”, “CTI above 0.9” and “KalmanTrend above 2” are guidelines, not boundaries beyond which a trend must continue.
In the JetScalp terminal
LinearRegression, CorrelationTrend, ADX, SuperTrend, ParabolicSAR, KalmanTrend; the efficiency of a move — EfficiencyRatio.
Summary
- A trend is defined by its horizon, and each indicator has its own.
- Slope and straightness, directionality, a trailing line and confidence in speed are four different definitions of a “strong trend”.
- ADX does not know the direction and lags more than most indicators; SuperTrend and ParabolicSAR are trailing-stop rules, not a measure of strength.
- A trend on an indicator is a description of past bars and context for a decision; read it together with levels and order flow.
Check yourself
- Why can ADX be high during a fall if it is called the “average directional index”?
- CorrelationTrend equals 0.9. What share of the move does the line explain, and what does that say about future movement?
- What happens to the number of SuperTrend reversals in a range if you reduce the multiplier from 3 to 1.5?