Volatility and anomalies
Volatility is the size of price changes regardless of their direction. It determines the distance to the stop, the position size, the chance of reaching a target within the allotted time, and how ordinary a move looks. An anomaly is a value that is rare for its context: the same bar volume is ordinary at 10:00 and unusual at 21:00. This is a practice-level lesson with advanced sections: how the terminal’s indicators measure volatility, what bands and squeezes show, how indicators mark unusual bars, and how a spike differs from a change in market behavior.
What is measured
| Measure | Indicators | Units |
|---|---|---|
| Smoothed true range of a bar | ATR | in instrument price |
| Estimate from the bar’s OHLC | Volatility (Parkinson, Garman–Klass, Rogers–Satchell, Yang–Zhang) | percent per bar |
| Dispersion of prices around the average | BollingerBands | in price (σ) |
| Average range around the average | KeltnerChannel | in price (ATR) |
| Compression and expansion | Squeeze; Volatility in the Percentile and Ratio modes | squeeze points; 0–100; ratio |
| Path efficiency | EfficiencyRatio, Choppiness | 0–1; 0–100 |
ATR smooths the true range — the largest of High − Low and the distances from the previous close to High and Low; this way gaps between bars are counted too. Volatility estimates the variance from the bar’s four prices: using the range and body of the bar makes the estimate more precise than closes alone, and in percent it can be compared across instruments.
Bollinger Bands are the average ± 2 standard deviations of prices over 20 bars from their average. This is not the same as the dispersion of returns: in a steady trend the window’s prices are far from their average, and the bands widen even when the bars are calm. The Keltner Channel places several ATRs around the average, so in a trend without wide bars it stays narrow. Squeeze marks the moments when the Bollinger Bands are narrower than the Keltner Channel — the dispersion of prices is smaller than the usual size of the bars.
Compression and expansion
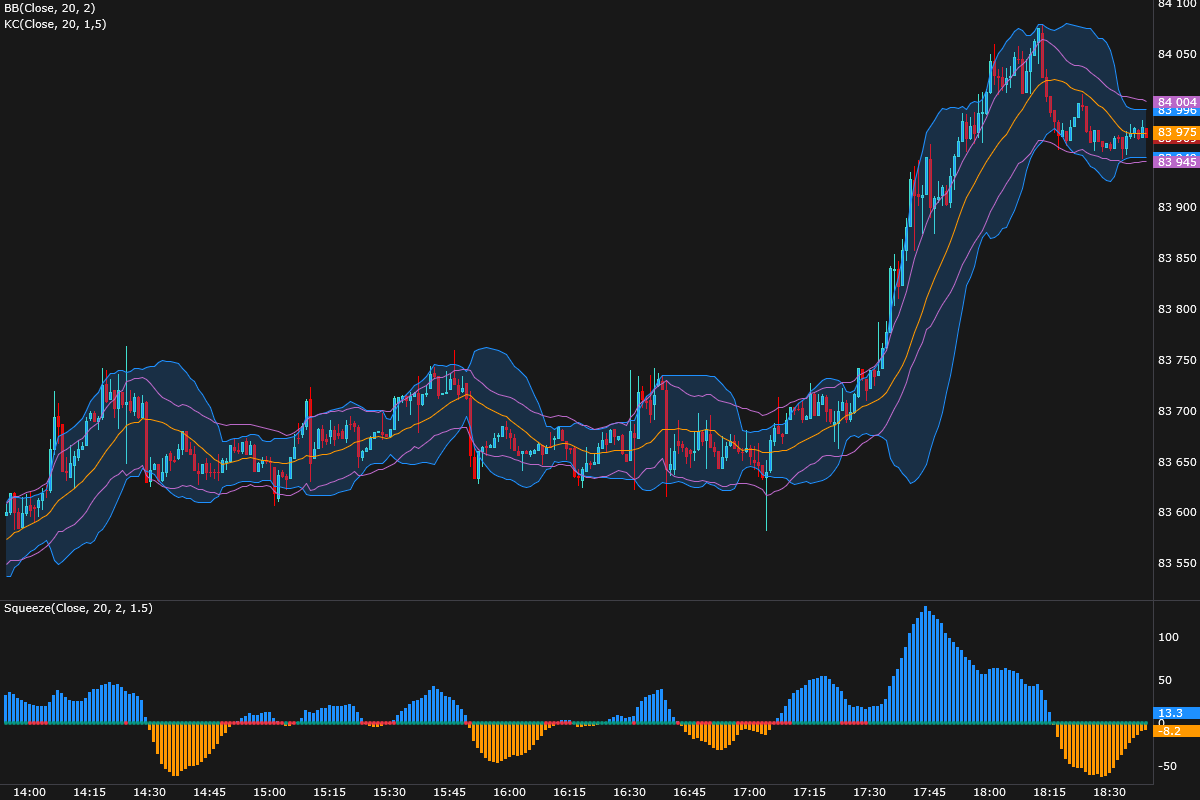
Before the 17:25 impulse, volatility had been low for several hours, and Squeeze marked a squeeze several times. How to read it:
- A squeeze says that the market is calm right now: the dispersion of prices is smaller than the usual bar size. It is a good moment to mark the range boundaries in advance and decide what you will do when the price leaves them.
- A squeeze does not set the direction. It occurs before moves up and down alike; the momentum histogram shows a move that has already started.
- Nor the timing. A squeeze on one-minute bars can last for hours and end in the evening lull: in the picture there were several squeeze episodes before the impulse without any move.
Volatility clusters, direction does not
The most robust property of volatility: large moves are more often followed by large ones, and small moves by small ones. Direction, meanwhile, hardly repeats: the sign of a one-minute price change is almost unrelated to the sign of the following minutes, while the size of the change is related noticeably and for a long time. The volatility of neighboring days is related in the same way: a turbulent day is more often followed by a turbulent one. Part of this relationship is the daily profile (the market is always more active at certain hours, see the section below), but it remains without it too.
The practical conclusion: recent volatility is a good guide to the near future, which is why it makes sense to base stops and position size on ATR. Recent direction gives no such hint — read it together with levels and the market regime.
Volatility by time of day
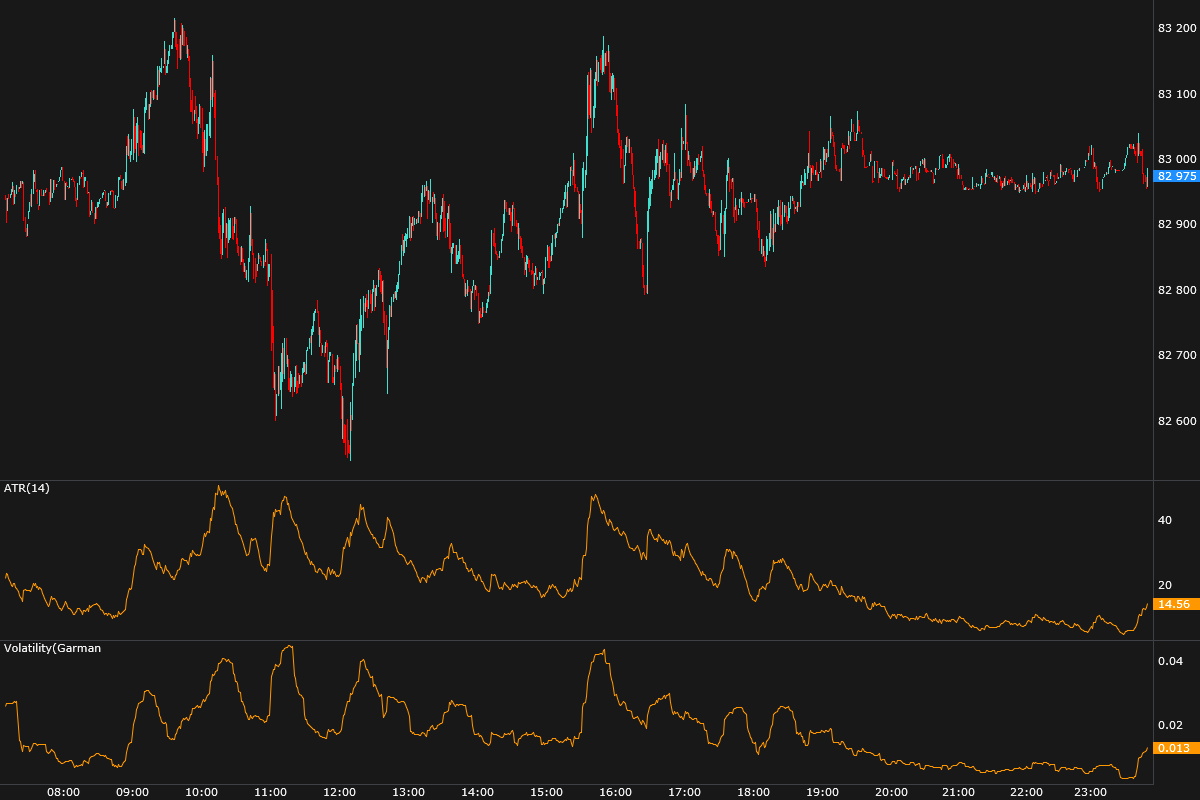
The range of a one-minute bar changes through the day: it is largest after the main session opens and noticeably smaller in the evening session. ATR(14) on one-minute bars is the movement of the last 14 minutes: it is higher during the day and lower in the evening, and “ATR went up” at the start of the day is the normal time-of-day profile, not a regime shift. It makes sense to compare volatility with the same time of day — RelativeVolume with the Bar range measure does exactly that (see Adjusting for the time of day). How volume is distributed by hour is shown in the Intraday levels lesson.
Three questions, three indicators
To call a bar unusual, you have to say what you compare it with. The terminal’s indicators set the context in three ways:
| Question | Indicator | Context |
|---|---|---|
| Is this bar unusual? | RobustZScore | 100 previous bars |
| Is the activity unusual for this time of day? | RelativeVolume | the same minutes of previous days |
| Has the move shifted persistently rather than for one bar? | Cusum | accumulated shifts in standard deviations |
Robust z-score and heavy tails
RobustZScore compares a bar with the median of the window’s previous bars and divides the deviation by the median absolute deviation (MAD). Unlike the mean and the standard deviation, the median and MAD are not shifted by the outliers themselves, so the estimate is robust.
For a normal distribution, happens for about one bar in two thousand. On real one-minute bars, the 3.5 threshold for the price change is exceeded many times more often. The reasons:
- Heavy tails. Large one-minute moves occur much more often than in a normal distribution.
- Volatility clustering. After a quiet hour, a 100-bar window “gets used to” small moves, and the first bars that are ordinary for an active market look like outliers.
- The daily profile. A 100-bar window does not know the time of day: in the morning it is filled with quiet evening-session bars, and the opening of the main session looks anomalous every day.
So the RobustZScore threshold is not a probability. If you need genuinely rare events, choose the threshold by how often it fires on your instrument and timeframe: for example, so that marks appear a few times a day rather than every 15 minutes.
More: the formula
The 0.6745 factor is chosen so that for a normal distribution matches the ordinary z-score, and then happens for 0.047% of values.
Adjusting for the time of day
Volume on MOEX one-minute bars depends strongly on the hour: the half hour from 10:00 collects much more volume than an evening-session half hour (see the Intraday levels lesson). If a spike is a bar with volume three times the average of the last 20 bars, the “spikes” will be mostly openings. RelativeVolume compares a bar with bars of the same minute on previous days and removes this profile: a large volume at 10:00 is expected, and what stands out is activity that is not usual at that time.
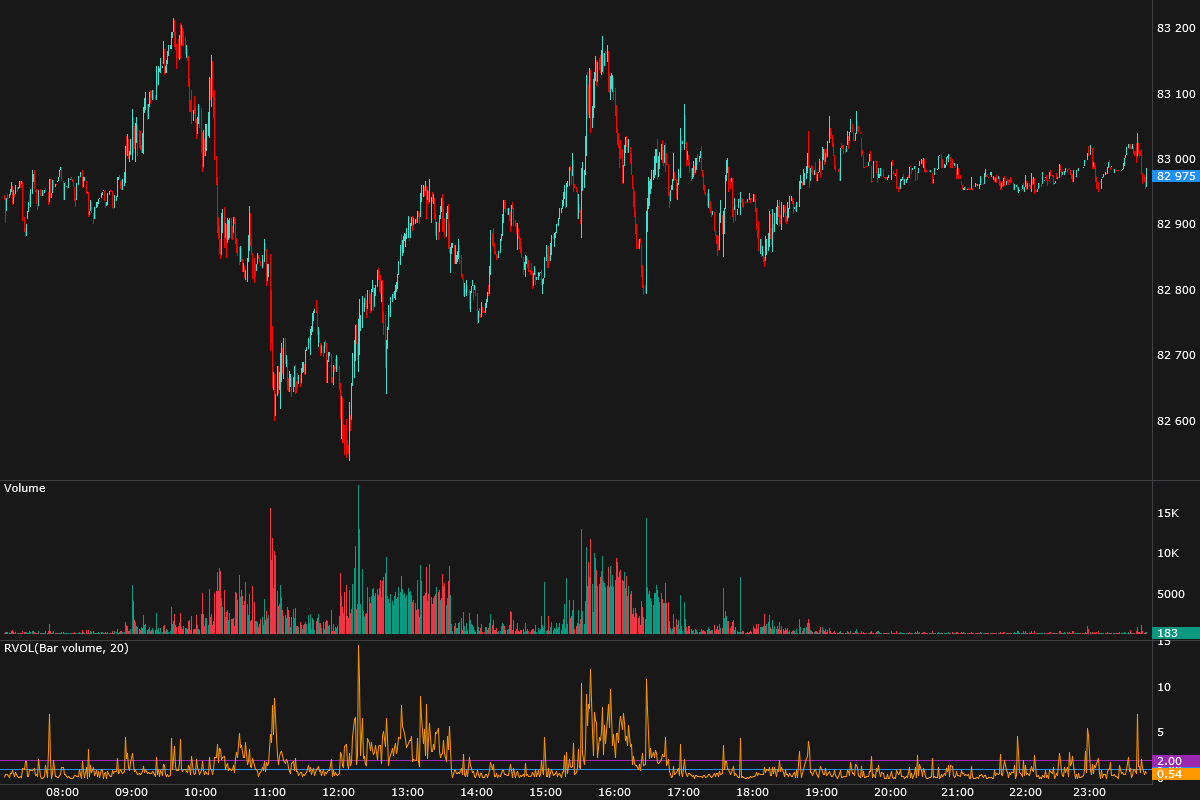
Tip: RelativeVolume looks for bars exactly one, two and more days earlier and needs at least 10 of the 20 previous days. After a change in the trading schedule, and after holidays and shortened days, morning minutes are for a while compared with days when there was no or less trading at that time — the morning RVOL is inflated or not calculated. In such weeks, compare volume with neighboring hours of the same day.
Cusum: a lasting shift, not a spike
The z-score answers about a single bar. Cusum accumulates bar returns converted to standard deviations and subtracts an allowance from each bar: small fluctuations do not grow the sum, while a series of bars in one direction does. The signal comes when the sum reaches the threshold; after that the count starts over.
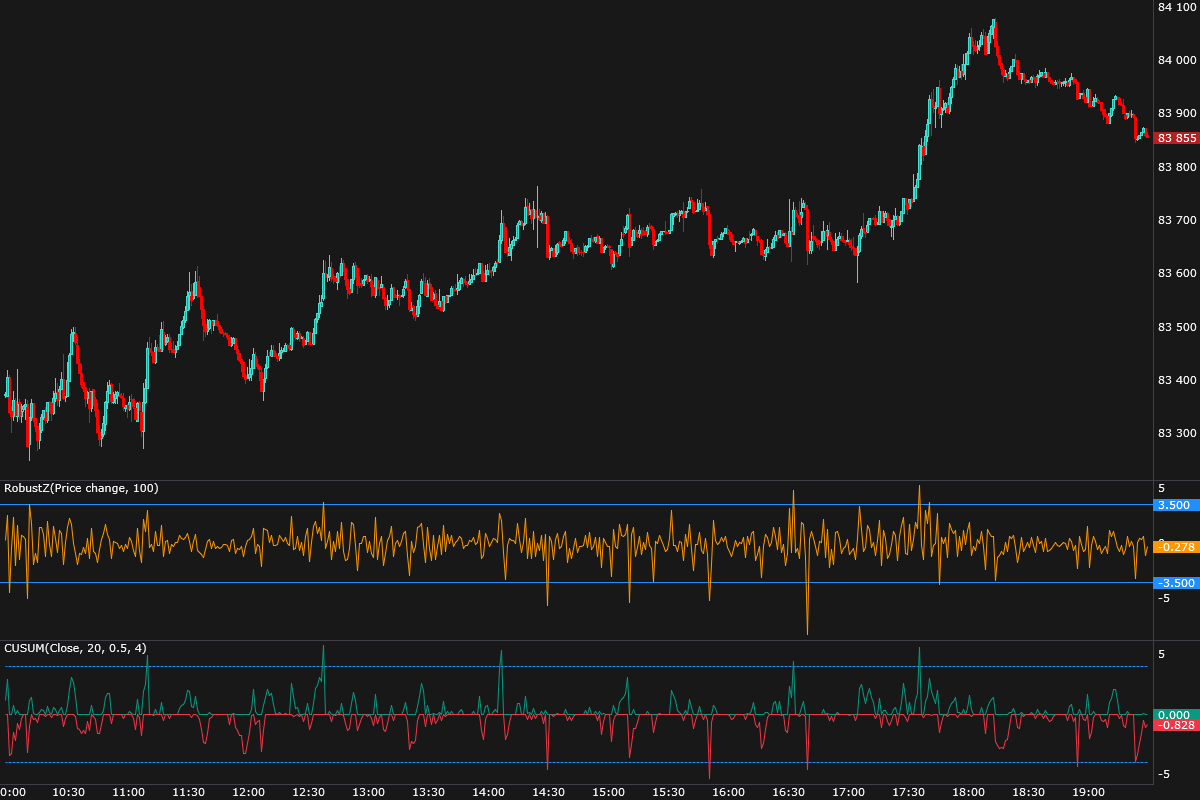
The picture shows both: RobustZScore goes beyond its levels many times a day, including in the range, while Cusum reaches the threshold both on the 17:30 impulse and on several short intraday moves. The Cusum threshold is the same trade-off as with every indicator: a higher threshold means fewer false marks and later real ones.
Spike or regime shift
One anomalous bar is not yet a change in market behavior. A regime shift is when the properties of movement change over an extended stretch: volatility, directionality, mean reversion. Signs of persistence:
- the anomaly repeats — several bars in a row or a series of Cusum signals in one direction;
- volatility changes, and changes for a long time: volatility clusters, so a spike in range often continues;
- regime metrics change — EfficiencyRatio, VarianceRatio, Choppiness (see the Market regimes lesson).
An anomaly indicator marks that a bar or a series of bars is unusual for the chosen context. A single sign is a reason to take a closer look; read it together with the level, the market regime and the risk.
How to use it
- Base stops and position size on ATR. A stop closer than the usual bar range will be knocked out by noise; the position size is calculated from the distance to the stop (see the Risk and position size lesson).
- Compare with the same time of day or on a relative scale: the Percentile and Ratio modes of Volatility, RelativeVolume with the Bar volume or Bar range measure.
- A squeeze is a condition, not a direction. It says that the move is small now; levels and order flow will show where the breakout goes.
- Choose the anomaly threshold by frequency on your instrument, not from a normal distribution table.
- Remember what you are measuring. Bollinger Bands also widen from a trend, ATR from gaps, and Volatility is understated on second bars.
In the JetScalp terminal
Volatility: ATR, Volatility, BollingerBands, KeltnerChannel, Squeeze, EfficiencyRatio, Choppiness. Anomalies: RobustZScore, Cusum, RelativeVolume; volume and delta alert lines — in the Indicators section.
Summary
- Volatility is the size of changes without direction; ATR is in price, Volatility in percent per bar.
- Bollinger Bands measure the dispersion of prices around the average and widen in a trend; Squeeze shows compression, but neither the direction nor the timing of the breakout.
- The size of a move remembers the past for a long time, the direction does not: that is why stops and position size are based on ATR.
- Volatility and volume depend strongly on the time of day; compare with the same time — RelativeVolume.
- An anomaly is defined by its context; the 3.5 RobustZScore threshold on one-minute bars fires much more often than a normal distribution promises. Cusum marks a persistent shift, and a regime shift is confirmed by duration.
Check yourself
- Why do Bollinger Bands widen in a steady trend even when the bars are small?
- What does a strong relationship between the size of neighboring moves, with almost no relationship between their direction, mean for someone who places stops?
- ATR at 10:05 is twice as high as at 21:00. Is there anything unusual about this?
- Why does a RobustZScore with a 100-bar window fire more often in the morning than during the day?
- How does a Cusum signal differ from the z-score going beyond 3.5?