Chart
The Chart tab shows a candlestick chart of the symbol open in the order book, with indicators and drawings. From the chart you can place orders, stop loss, take profit and alerts, and drag their lines with a finger.
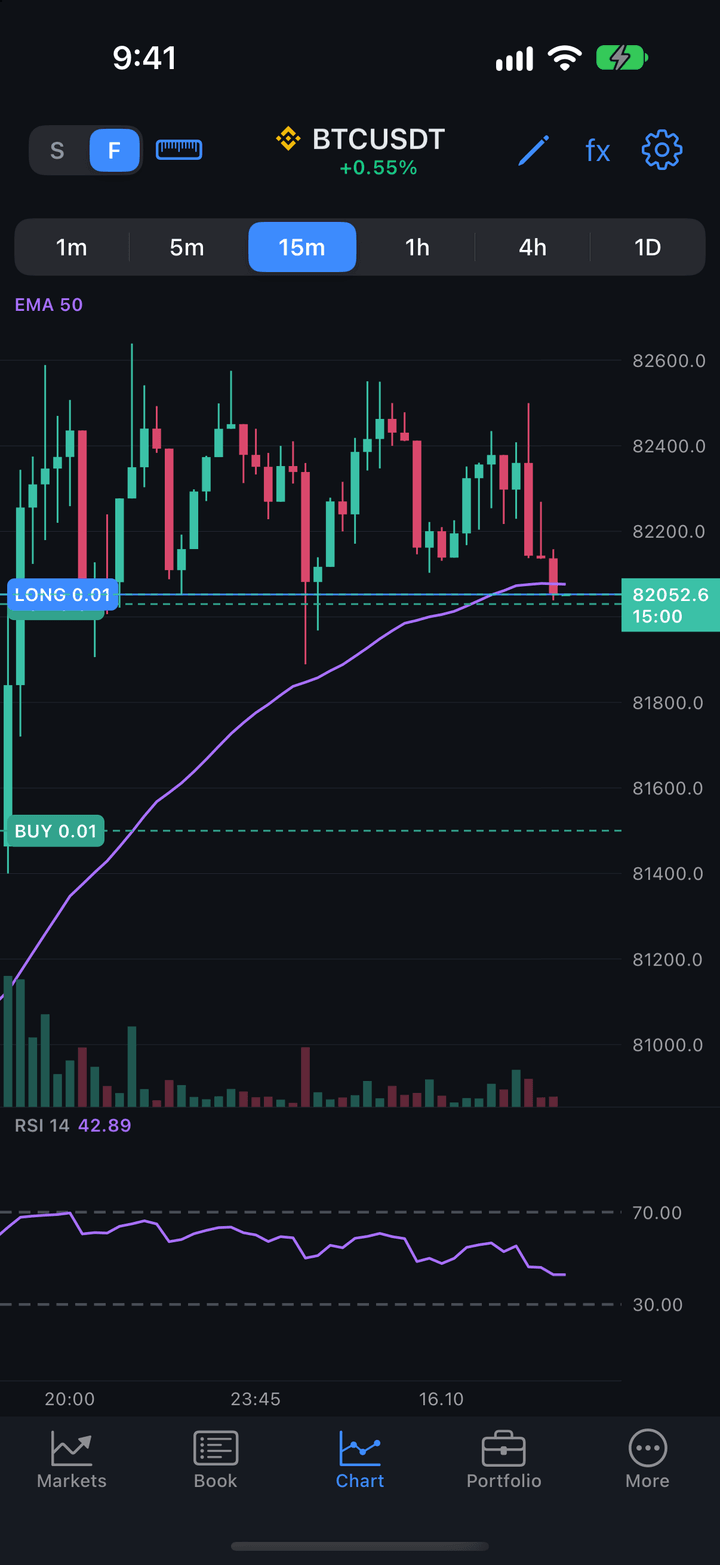
The chart shows the same symbol as the order book: choose it on the Markets tab or with the S | F switch in the header.
Header and timeframes
| Button | Description |
|---|---|
| S | F | Switch between spot and futures of the same symbol, if the exchange has the pair. The order book switches together with the chart. |
| Ruler | The ruler — measures bars, time and price change. |
| Name | Exchange icon, symbol name and the 24-hour price change. |
| Pencil | Drawing on the chart. |
| fx | Indicators. |
| Gear | Chart settings — the same as More → Settings → Chart. |
Below the header are the timeframe buttons. By default they are 1m, 5m, 15m, 1h, 4h and 1D; the set is changed in the chart settings (available: 1m, 3m, 5m, 15m, 30m, 1h, 2h, 4h, 6h, 12h and 1D). The selected timeframe is shared by all symbols. In landscape the timeframe buttons stand in a column on the left, and the chart takes the full height.
Bar history is loaded from the exchange, and after you sign in to your JetScalp account — from the JetScalp server. While it loads, the chart shows “Loading history…”. If the history doesn’t arrive, the chart is built from trades since it was opened. Times on the time axis are in the phone’s time zone, Moscow Exchange included.
Gestures
| Gesture | What it does |
|---|---|
| Drag left or right | Scroll through history; released with a flick, the chart keeps moving by inertia. |
| Pinch on the chart | Bar width: spread out — wider bars, pinch in — narrower. |
| Pinch on the price scale | Price zoom. After it you can also drag the chart by price. |
| Double-tap the chart | Jump to the latest bar; the zoom stays the same. |
| Double-tap the price scale | Back to automatic price scaling. |
| Touch and hold | A crosshair with the bar’s prices and a bell — alert at a price. |
While the chart is scrolled into history, new bars don’t move it, and a gray button with arrows appears at the bottom right — To the latest bar. The bar width is remembered: it is one for all symbols, timeframes and the chart next to the order book.
Crosshair. Touch and hold the chart to get a crosshair. At the top of the chart you see the bar’s O, H, L, C prices and its volume V, below them the indicator values on that bar, and on the pane under the chart — the values of its lines. Move your finger without lifting it, and the crosshair follows.
Under the last price label on the scale is the time to bar close: “00:42”, for hourly and daily bars — “03:59:12”.
Alerts and lines on the chart
The Chart tab doesn’t place orders — only alert levels. You can trade from the chart next to the order book: Trading from the chart.
Alert at a price
- Touch and hold the chart and move the crosshair to the price you need.
- Lift your finger. The crosshair stays at that price, and a bell appears at the price scale.
- Tap the bell — the alert is set at this price right away.
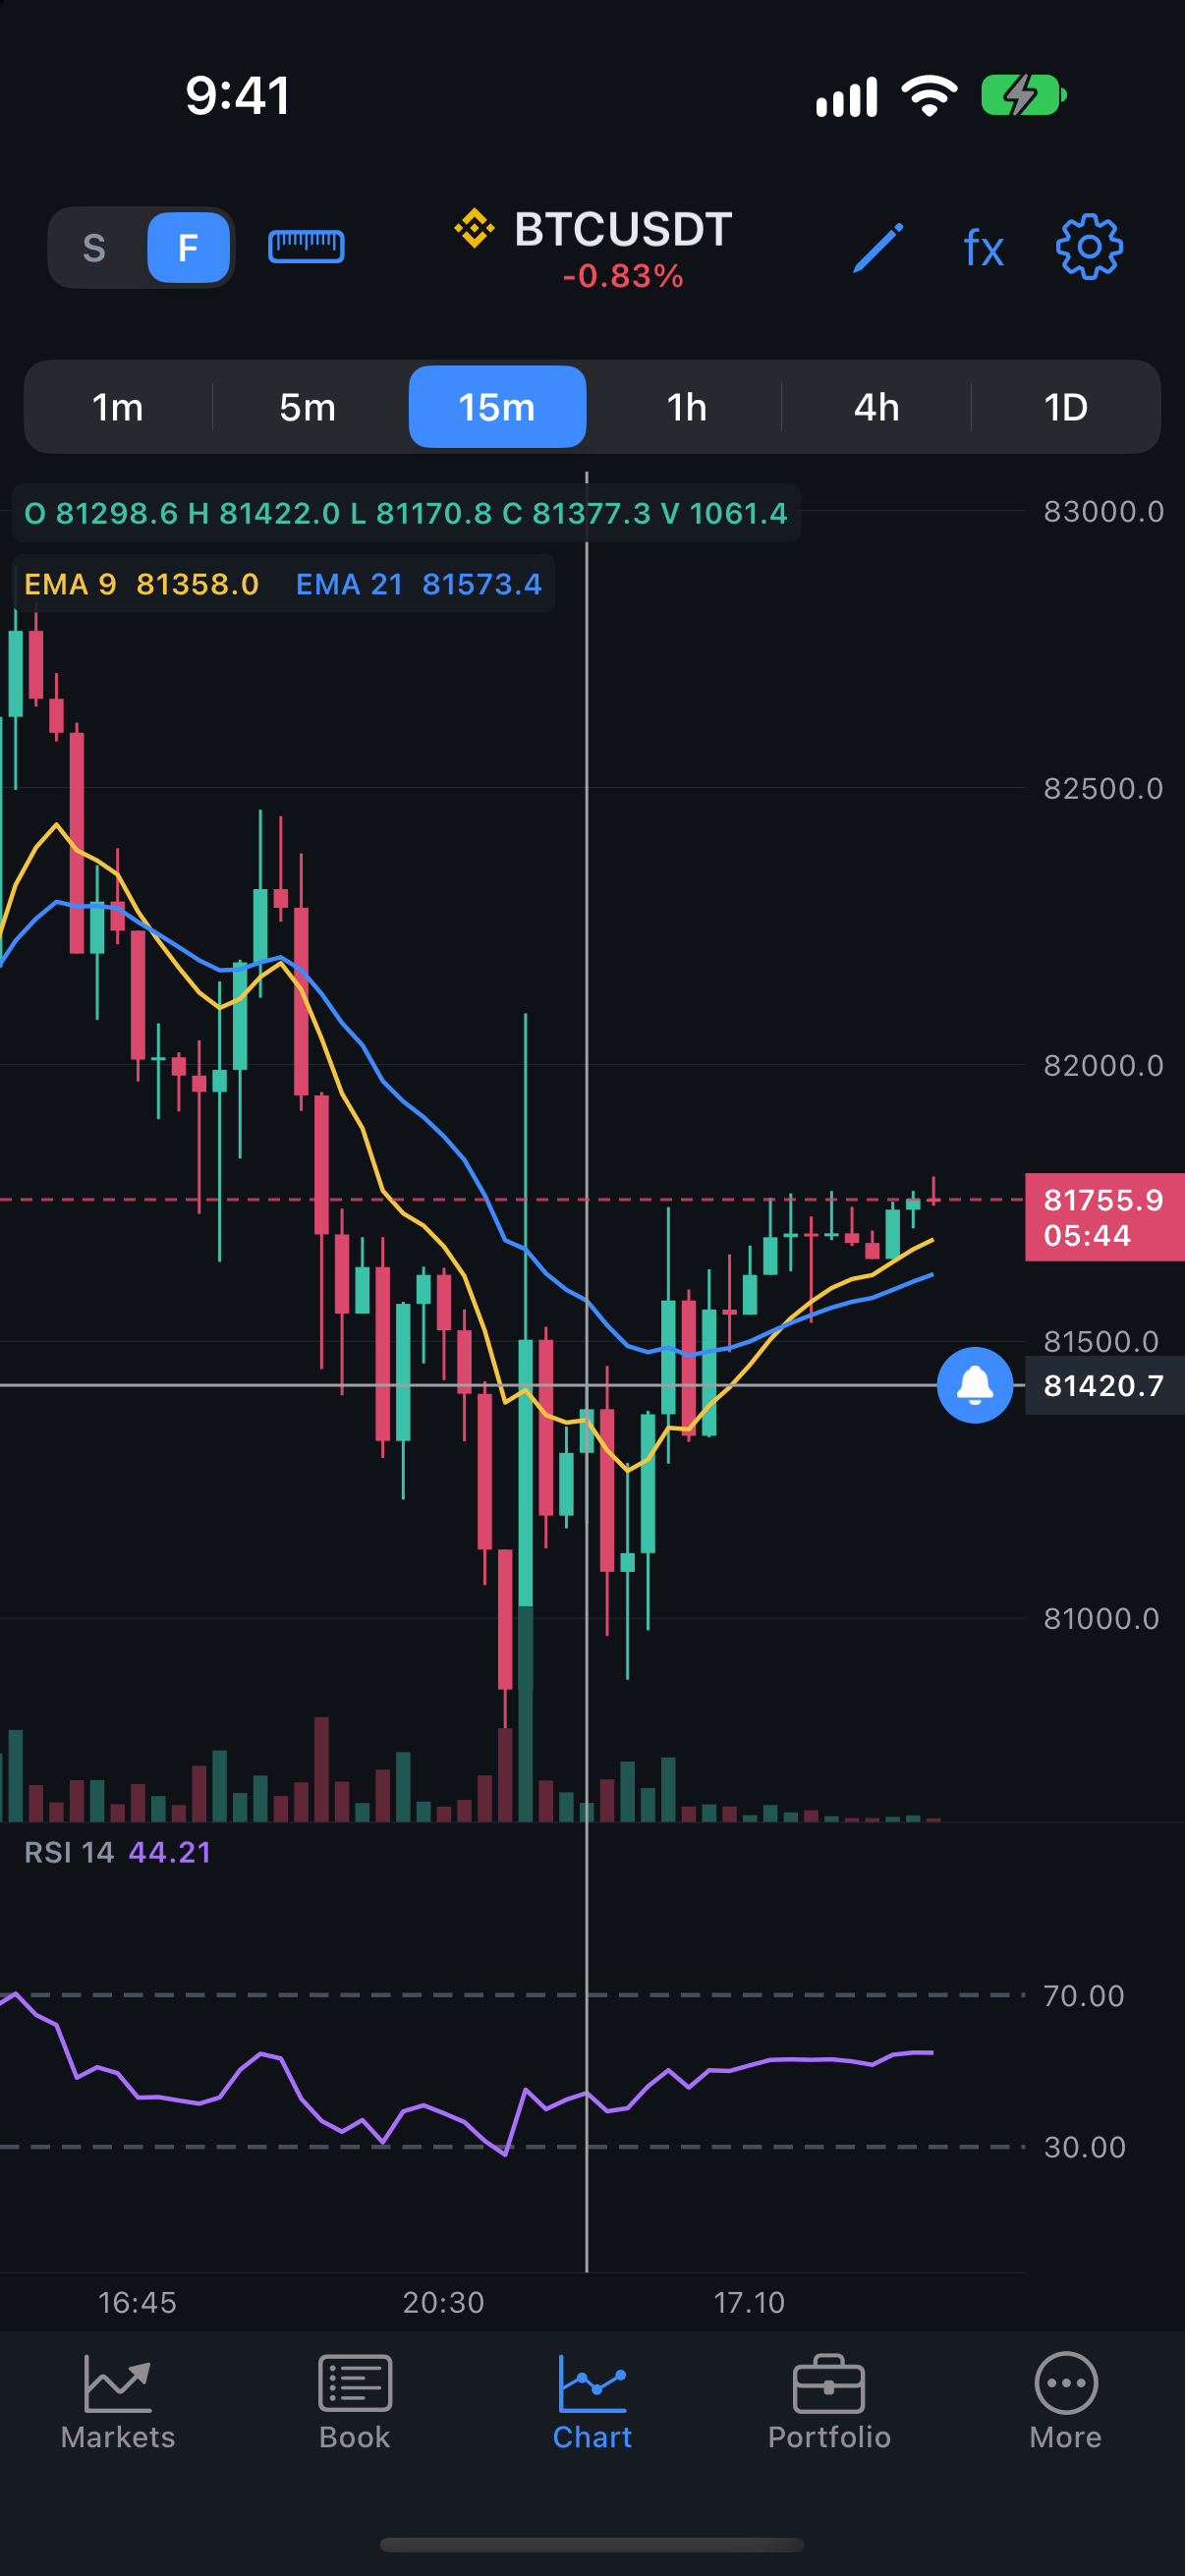
Alerts require signing in to your JetScalp account: without it, the bell offers to sign in. See Alerts and notifications. A tap on the chart away from the bell removes the crosshair.
Lines
Your orders, the position’s entry price, stop loss (SL), take profit (TP), liquidation price (LIQ) and alert levels are shown on the chart as lines with a price label. A level beyond the visible area is pinned to the edge with an arrow.
Order and position lines are only shown here: they don’t respond to taps and can’t be dragged. Cancel an order, close a position or move a stop loss in the order book or in Portfolio.
An alert line (ALERT):
- tap it — Remove alert;
- drag it with your finger to another price — the alert moves there.
Indicators
Tap fx — the Indicators list opens at the bottom, and the chart above it stays visible. Indicators are shared by all symbols.
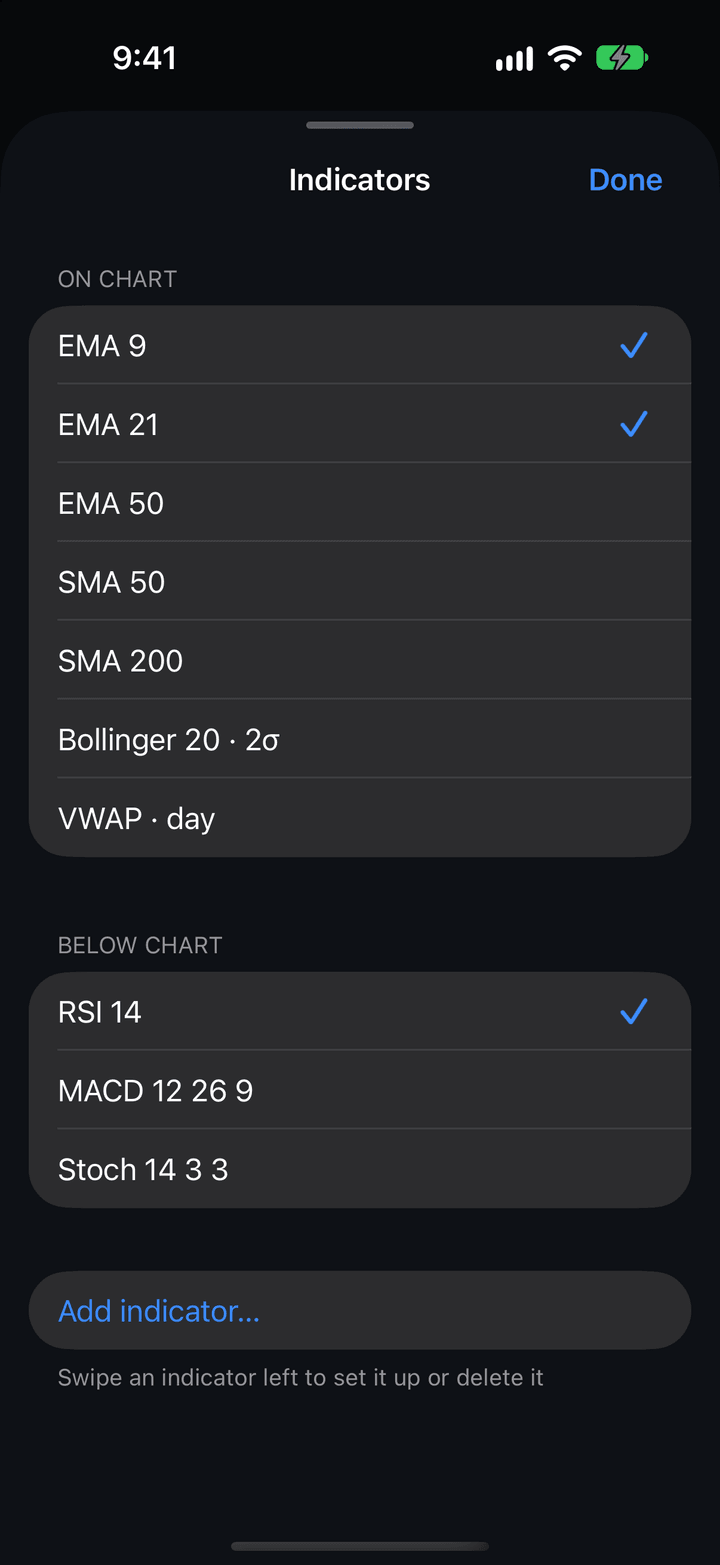
- On chart — indicators over the candles, Below chart — indicators on a separate pane under the chart.
- Tap an indicator to turn it on or off. There is one pane under the chart: turning on another pane indicator turns off the previous one.
- Add indicator… — choose a type, set the parameters and tap Add. The new indicator is on right away.
To set up or delete an indicator, swipe it left on iPhone (Settings, Delete) or touch and hold it on Android (Settings…, Delete). Any indicator can be deleted, including a standard one: it can be brought back with Add indicator….
| Section | Indicators |
|---|---|
| On chart | EMA, SMA, WMA, Bollinger Bands, Keltner Channel, VWAP, Parabolic SAR, Fractals, High/Low. |
| Below chart | RSI, MACD, Stochastic, ADX, ATR, Bid/Ask, Delta, Cumulative Delta, Open Interest. |
Right after installation the list contains EMA 9, 21 and 50, SMA 50 and 200, Bollinger 20 · 2σ, VWAP, RSI 14, MACD 12 26 9 and Stochastic 14 3 3.
Indicator settings
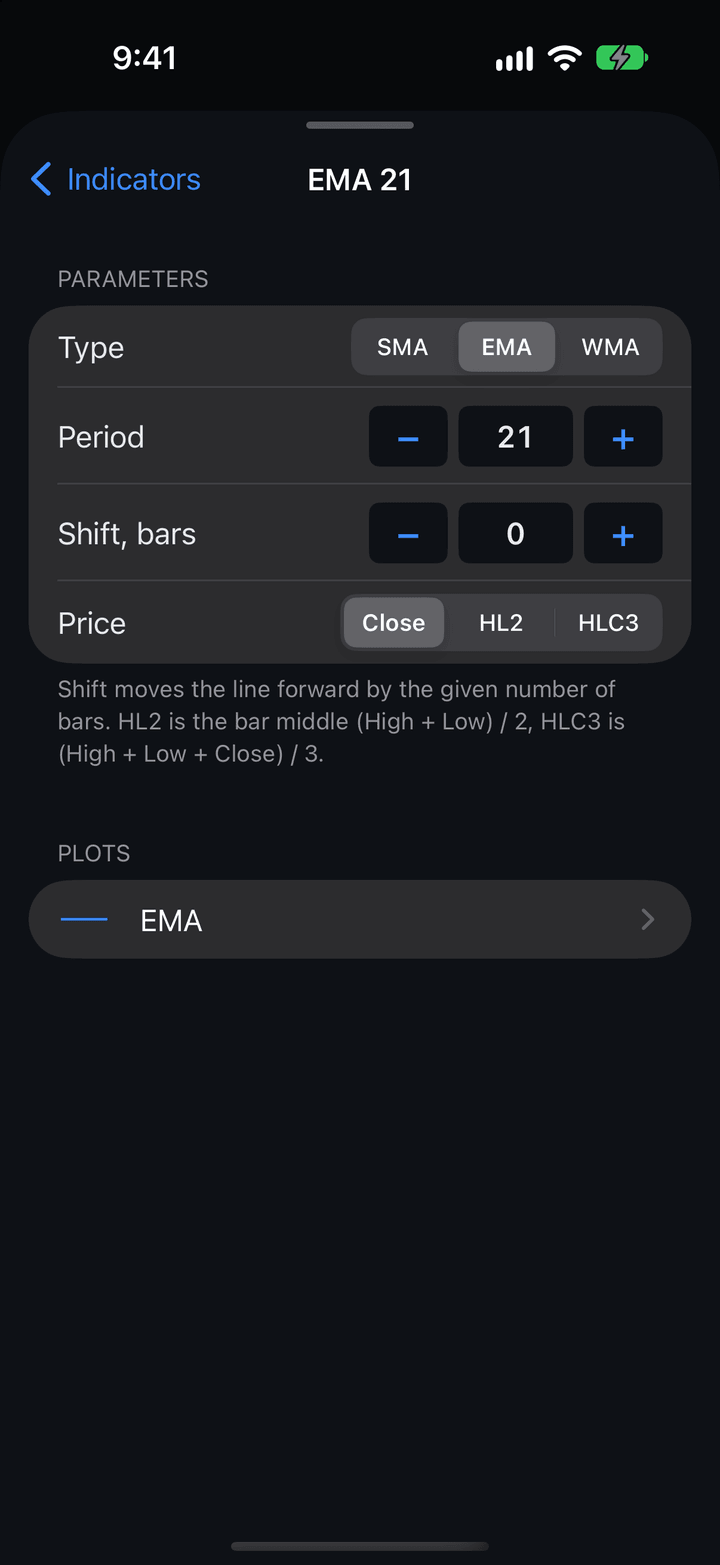
| Section | Description |
|---|---|
| Parameters | Periods, average type, source price, shift and other indicator parameters. Numbers are changed with − and + (hold for faster steps) or typed on the keyboard. |
| Plots | The indicator’s lines, histograms, dots and fills. A row opens the part’s settings: Show, Scale label, Color, Width and Style — Solid, Dashed or Dotted. |
| Levels | Upper and lower levels for RSI and Stochastic. |
Changes show on the chart immediately.
Buy and sell volumes (Bid/Ask, Delta, Cumulative Delta) have history on Binance and from the JetScalp server; on other exchanges — since the chart was opened. Open interest comes with the JetScalp server history after you sign in; without data the pane reads “No open interest data”.
Drawing
Tap the pencil in the header — the drawing panel opens above the chart. Tap it again to close the panel.
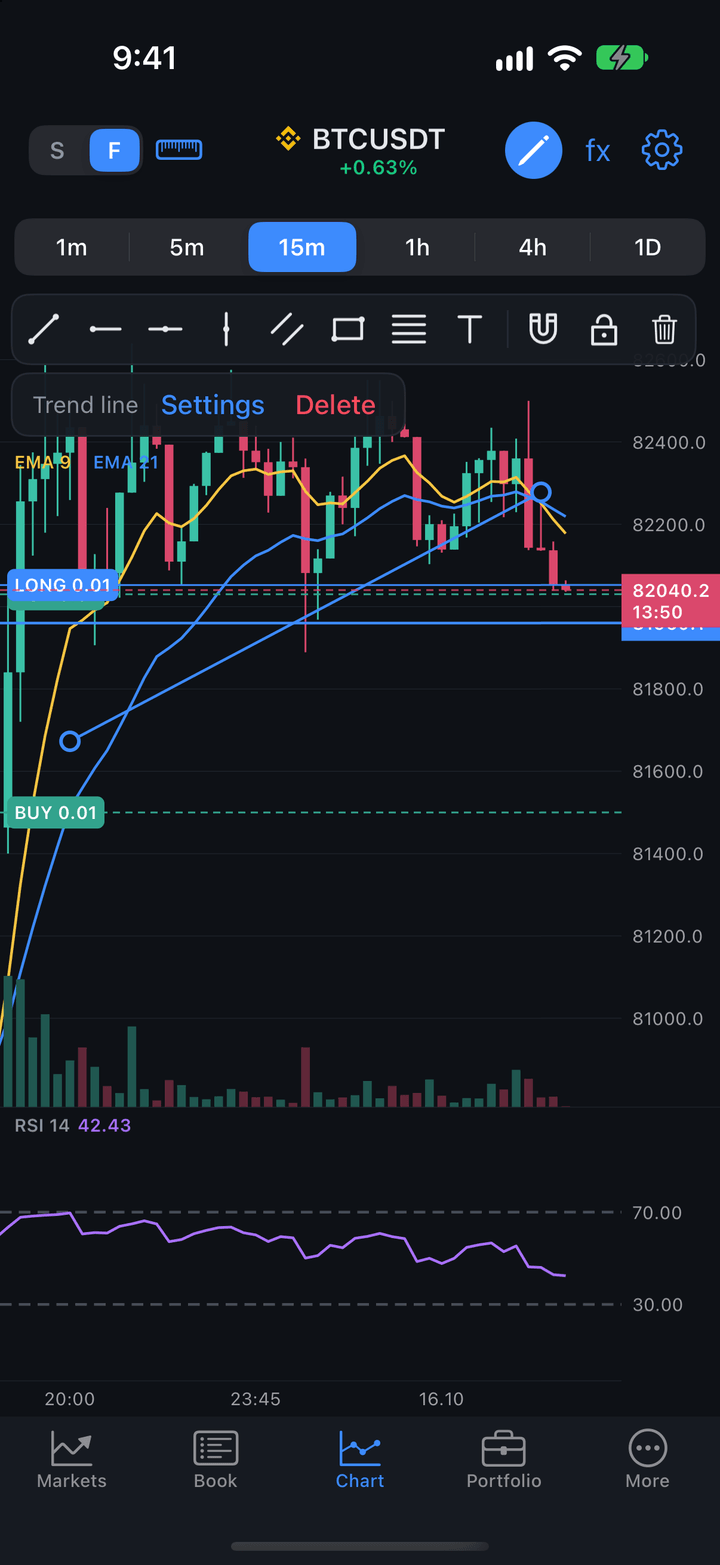
| Button | Description |
|---|---|
| Tools | Trend line, Horizontal ray, Horizontal line, Vertical line, Channel, Rectangle, Fibonacci retracement, Text. The selected one is highlighted. |
| Magnet | Snap the object’s points to the bar’s open, high, low and close. |
| Lock | Lock objects: objects don’t move, and dragging over them scrolls the chart. You can still select, set up and delete them. |
| Delete all objects | Delete all objects on the symbol’s chart, with confirmation. |
Below the panel is a hint for the selected tool, or the name of the selected object with the Settings and Delete buttons.
Placing an object
- Choose a tool on the drawing panel.
- Place a horizontal or vertical line, a ray or text with a tap on the chart. For a trend line, channel, rectangle or Fibonacci retracement, drag from the first point to the second; a simple tap places them at the default size.
- The placed object is selected, and the tool is deselected.
A channel is placed with the default width; the point in the middle of the parallel line changes the width. A new Text opens its settings right away so you can type the text.
Editing an object
- Tap an object to select it: the points used to change it appear. A tap on an empty spot clears the selection.
- Only the selected object moves — as a whole or by a point. A horizontal line moves only by price, a vertical one — only by time.
- Settings of the selected object: Color, line Width and Style; Extend left and Extend right (line, channel, Fibonacci); Caption or Text and Text size; Border, Background and Background color (rectangle, text).
Objects are saved per symbol and visible on all timeframes, and also on the chart next to the order book.
Ruler
The ruler measures a part of the chart: how many bars and how much time passed, and how much the price changed.
- Tap the ruler icon in the header (on the chart next to the order book — the ruler icon above the chart). The hint “Two taps measure bars, time and price change” appears.
- Tap the first point, then the second.
- A frame appears on the chart; under it — the price change and percent, and below — the number of bars and the time between the points: “+0.00265 (+3.33%)” and “25 bars · 25m”.
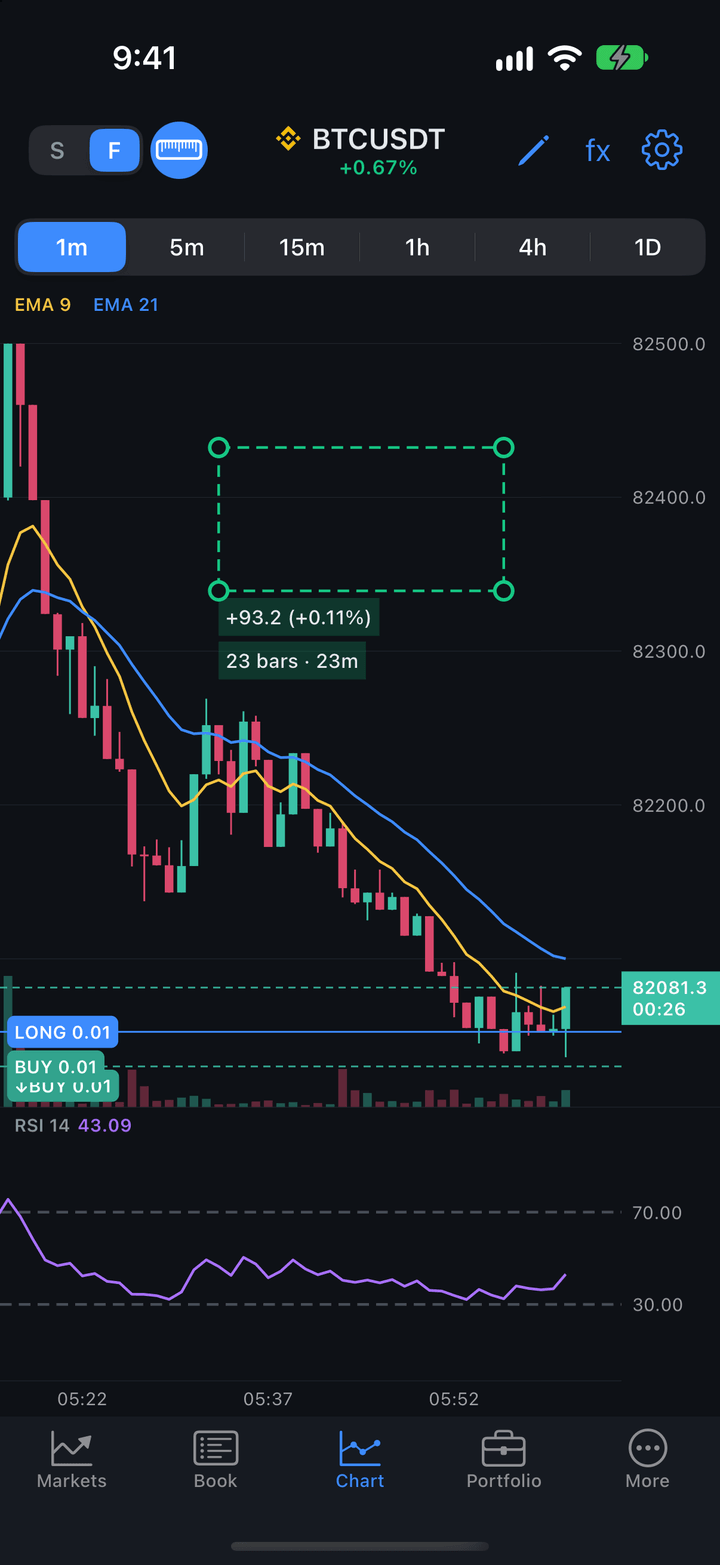
Drag the frame by its corners to resize it, or from inside to move it as a whole. A tap outside the frame starts a new measurement. While the ruler is on, taps on the chart go to it instead of the order and object menus. Tap the icon again to turn the ruler off and remove the frame.
Chart settings
The gear in the header opens the chart settings; the same is More → Settings → Chart. The settings are shared by the chart on the tab and the chart next to the order book.
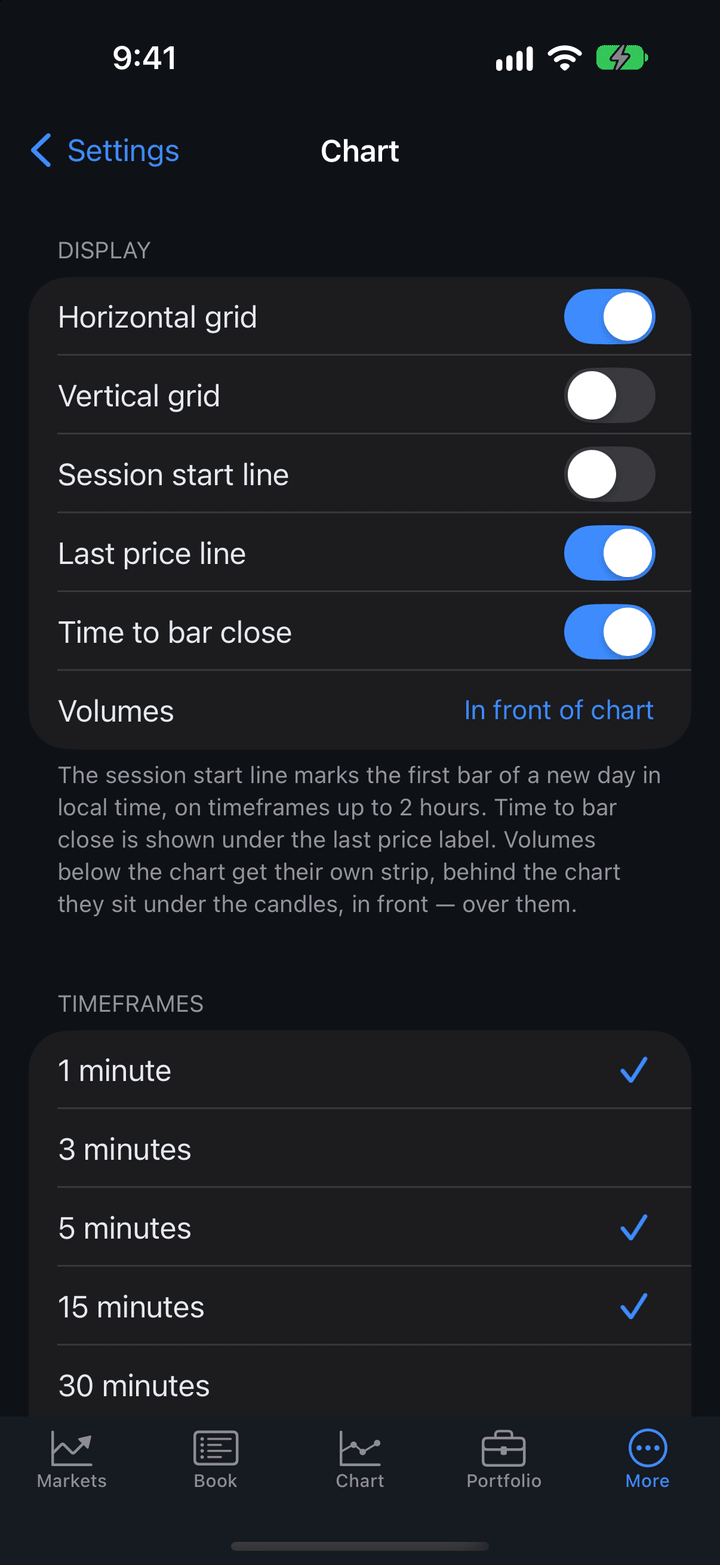
| Setting | Description |
|---|---|
| Horizontal grid | Lines at the scale prices. On by default. |
| Vertical grid | Lines at the time scale labels. Off by default. |
| Session start line | A line at the first bar of a new day in local time, on timeframes up to 2 hours. Off by default. |
| Last price line | A dashed last price line across the chart. On by default. |
| Time to bar close | A countdown under the last price label. On by default. |
| Volumes | Below chart (a strip of its own, the default), Behind chart (under the candles), In front of chart (over the candles) or Hide. |
| Timeframes | Which timeframes appear as buttons above the chart — from one to seven. By default 1m, 5m, 15m, 1h, 4h and 1D. |
Zero shortening for tiny prices on the chart scale is set together with the order book — More → Settings → Order book → Prices. Candle colors are in More → Settings → Order book & chart colors.