JetScalp footprint
Footprint chart: volume and delta inside every bar
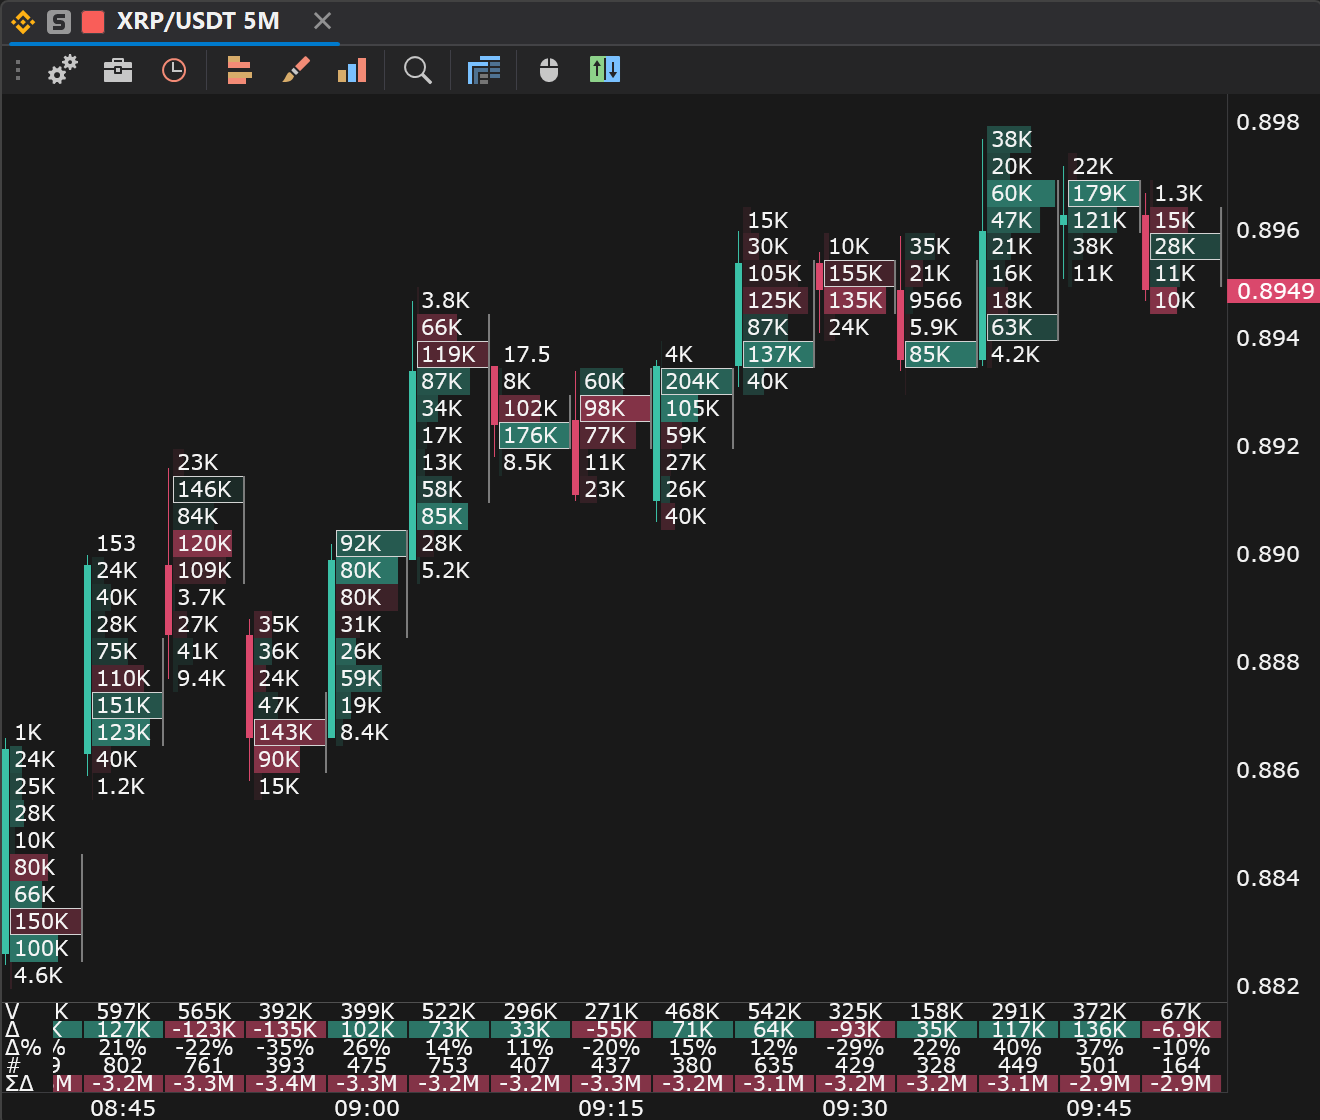
A footprint shows how much was bought and sold at each price inside a bar. In JetScalp it is a chart type with imbalances, bar signals, a profile and alerts, on timeframes from 1 second.
FEATURES
01
Cell modes
Bid × Ask, volume, delta, trade count and other modes; the bar's POC and value area, statistics below the bars.
02
Presets and builder
Ready presets in one click and the footprint builder, which shows the settings on a live example. Your own presets are saved.
03
Imbalances and auctions
Diagonal imbalances, stacked imbalances and unfinished auctions as zones until the price touches them, with alerts.
04
Bar signals
Unusual volume and delta, delta divergence, exhaustion and absorption at extremes, marked at closed bars.
05
Profile and past day levels
A volume profile at the right edge, the POC, VAH and VAL of past days as lines on the chart, and an alert when the price reaches them.
06
Large trades and sweeps
Circles sized by order volume, sweeps through several price levels and a cluster search by your own conditions, with alerts.
Who it is for
A scalper or intraday trader who reads order flow: where buyers and sellers were more active, where a move was absorbed and where an auction was left unfinished.
FIRST STEPS
How to turn the footprint on
- 01Open a chart of the instrument.
- 02Click Chart type on the main panel and choose Footprint.
- 03Pick a preset or open the footprint builder.
- 04Choose the row size and the timeframe for the instrument.
- 05Turn on the alerts you need; they arrive in the Notifications window.
Footprint on the chart and in the order book
The order book window has cluster history too, next to the tape and the orders. The timeframe list is shared by the chart and the order book clusters, and the tutorial explains how to read a footprint: delta, imbalances, absorption and exhaustion.