JetScalp chart
Charts from 1 second: analysis, footprint and trading
The JetScalp chart lets you analyze price action, volumes, levels and signals in a single window. It is linked with the other terminal windows and built for active trading.
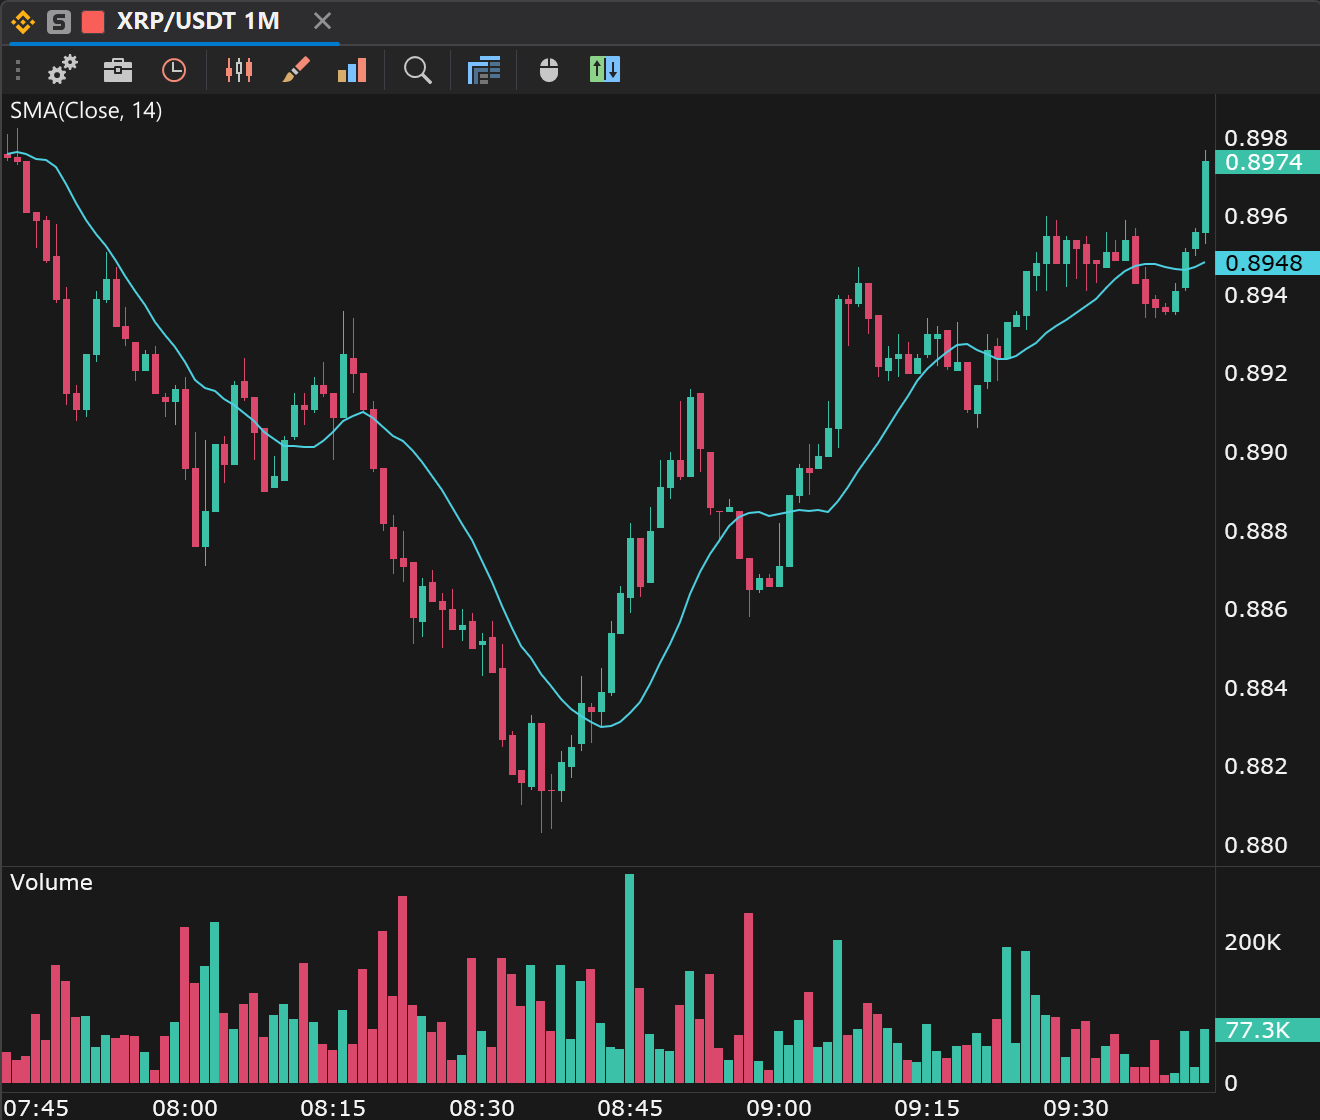
FEATURES
01
From 1 second
Second charts for precise entries and your own timeframes, with one list for the chart and the order book clusters.
02
Up to 20,000 bars of history
See market structure and key levels on a long history of any timeframe.
03
Footprint chart
The fourth chart type: Bid × Ask, delta, imbalances, bar signals, a profile and alerts.
04
Indicators and markup
Over 40 indicators, from moving averages and VWAP to delta and Bid/Ask volumes, and drawing objects to mark levels and zones.
05
Trading from the chart
An order panel, order and position lines you move with the mouse, stop loss and take profit, closing and reversing the position.
06
Signal levels
Place a level on the chart, and a cloud signal sends a push to your phone and a Telegram message.
Who it is for
A scalper who marks levels on the chart and wants to know when the price comes close without watching the screen all the time.
FIRST STEPS
How to start working with the chart
- 01Open the instrument from the watchlist, the screener or the order book.
- 02Add a chart window to your workspace.
- 03Choose the chart type, the timeframe and the parameters you need.
- 04Add indicators, levels or drawing objects.
- 05Link the chart with the order book to switch between instruments quickly.
A level on the chart, an alert on your phone
Mark a level right on the chart and make it a cloud signal: the JetScalp server sends a push to your phone and a Telegram message, even with the terminal closed.